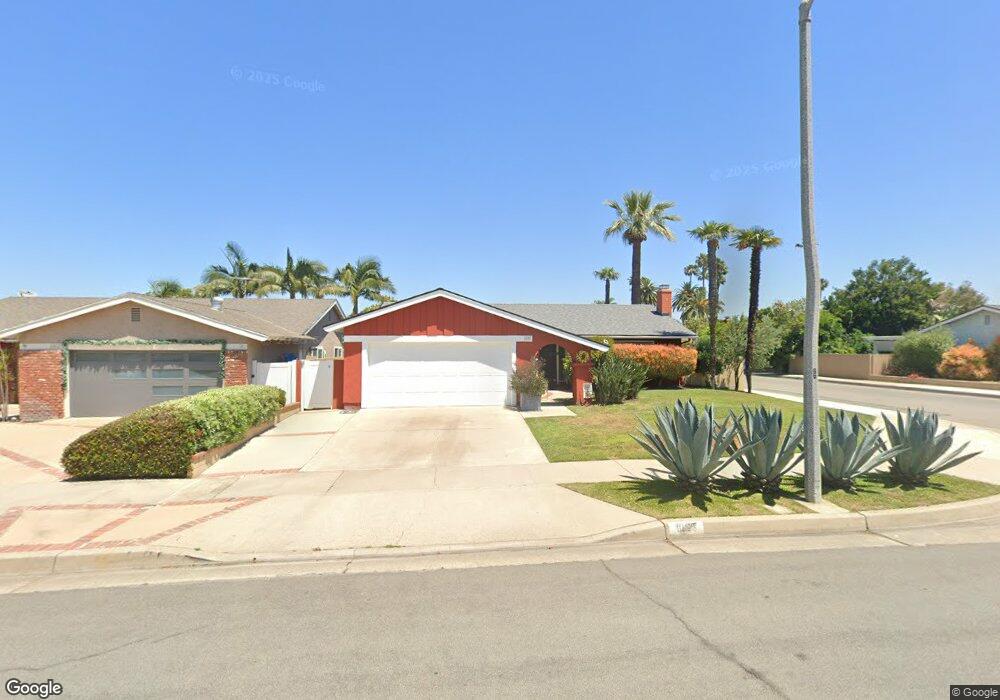
1037 E Chalynn Ave Orange, CA 92866
Estimated Value: $1,124,000 - $1,220,339
3
Beds
2
Baths
1,520
Sq Ft
$763/Sq Ft
Est. Value
About This Home
This home is located at 1037 E Chalynn Ave, Orange, CA 92866 and is currently estimated at $1,159,835, approximately $763 per square foot. 1037 E Chalynn Ave is a home located in Orange County with nearby schools including Palmyra GATE Magnet, Yorba Middle School, and Orange High School.
Ownership History
Date
Name
Owned For
Owner Type
Purchase Details
Closed on
Aug 1, 2006
Sold by
Jones Stephen B and Reiner Jones E
Bought by
Jones Stephen B and Jones Elisabeth Reiner
Current Estimated Value
Purchase Details
Closed on
May 21, 1999
Sold by
Bonsor George W
Bought by
Jones Stephen B and Reiner Jones E
Home Financials for this Owner
Home Financials are based on the most recent Mortgage that was taken out on this home.
Original Mortgage
$218,250
Interest Rate
7.5%
Purchase Details
Closed on
Apr 28, 1998
Sold by
Bonsor George W
Bought by
Bonsor George W and The George W Bonsor Trust
Purchase Details
Closed on
Jan 9, 1998
Sold by
Bonsor George W
Bought by
Bonsor George W
Home Financials for this Owner
Home Financials are based on the most recent Mortgage that was taken out on this home.
Original Mortgage
$188,000
Interest Rate
7.14%
Purchase Details
Closed on
Aug 8, 1997
Sold by
Bonsor George W
Bought by
Bonsor George W and The George W Bonsor Trust
Create a Home Valuation Report for This Property
The Home Valuation Report is an in-depth analysis detailing your home's value as well as a comparison with similar homes in the area
Home Values in the Area
Average Home Value in this Area
Purchase History
| Date | Buyer | Sale Price | Title Company |
|---|---|---|---|
| Jones Stephen B | -- | None Available | |
| Jones Stephen B | $242,500 | First Southwestern Title Co | |
| Bonsor George W | -- | -- | |
| Bonsor George W | -- | Fidelity National Title Ins | |
| Bonsor George W | -- | -- |
Source: Public Records
Mortgage History
| Date | Status | Borrower | Loan Amount |
|---|---|---|---|
| Previous Owner | Jones Stephen B | $218,250 | |
| Previous Owner | Bonsor George W | $188,000 |
Source: Public Records
Tax History
| Year | Tax Paid | Tax Assessment Tax Assessment Total Assessment is a certain percentage of the fair market value that is determined by local assessors to be the total taxable value of land and additions on the property. | Land | Improvement |
|---|---|---|---|---|
| 2025 | $4,233 | $377,696 | $259,101 | $118,595 |
| 2024 | $4,233 | $370,291 | $254,021 | $116,270 |
| 2023 | $4,136 | $363,031 | $249,040 | $113,991 |
| 2022 | $4,053 | $355,913 | $244,157 | $111,756 |
| 2021 | $3,941 | $348,935 | $239,370 | $109,565 |
| 2020 | $3,904 | $345,358 | $236,916 | $108,442 |
| 2019 | $3,855 | $338,587 | $232,271 | $106,316 |
| 2018 | $3,796 | $331,949 | $227,717 | $104,232 |
| 2017 | $3,641 | $325,441 | $223,252 | $102,189 |
| 2016 | $3,571 | $319,060 | $218,874 | $100,186 |
| 2015 | $3,518 | $314,268 | $215,586 | $98,682 |
| 2014 | $3,441 | $308,112 | $211,363 | $96,749 |
Source: Public Records
Map
Nearby Homes
- 1201 E Fairway Dr
- 700 E Lake Dr Unit 111
- 1243 E Almond Ave
- 354 E Culver Ave
- 236 S Shaffer St
- 1314 E Chapman Ave
- 1342 E Chapman Ave
- 2726 Concord St
- 178 N Monterey Rd
- 255 N Waverly St
- 2624 Forest Lake Unit 13
- 2544 Park Lake
- 660 S Glassell St Unit 48
- 660 S Glassell St Unit 99
- 660 S Glassell St Unit 36
- 2528 Park Lake Unit 108
- 2624 N Tustin Ave Unit D (141)
- 1514 E Palm Ave
- 369 S Jennifer Ln
- 2604 N Tustin Ave Unit C
- 1025 E Chalynn Ave
- 1036 E Mardell Ave
- 1103 E Chalynn Ave
- 1028 E Mardell Ave
- 1017 E Chalynn Ave
- 1100 E Mardell Ave
- 1018 E Mardell Ave
- 1038 E Chalynn Ave
- 1109 E Chalynn Ave
- 1028 E Chalynn Ave
- 1046 E Chalynn Ave
- 1005 E Chalynn Ave
- 1110 E Mardell Ave
- 1006 E Mardell Ave
- 1018 E Chalynn Ave
- 1106 E Chalynn Ave
- 1121 E Chalynn Ave
- 945 E Chalynn Ave
- 1008 E Chalynn Ave
- 1120 E Mardell Ave
Your Personal Tour Guide
Ask me questions while you tour the home.