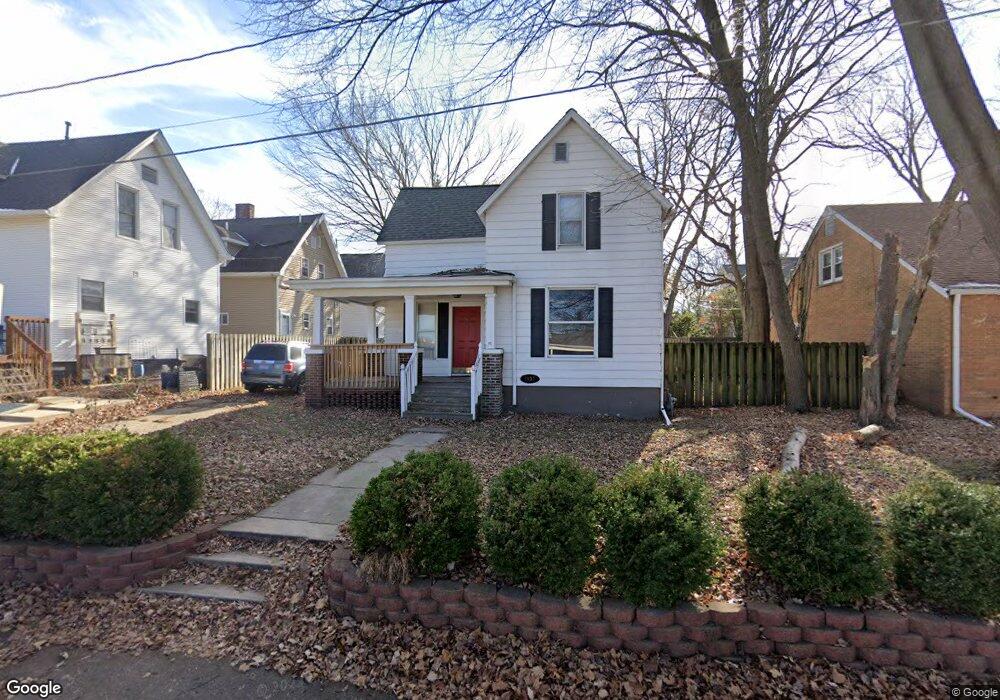
1037 E Front St Bloomington, IL 61701
Founders Grove NeighborhoodEstimated Value: $112,000 - $147,471
3
Beds
1
Bath
1,728
Sq Ft
$76/Sq Ft
Est. Value
About This Home
This home is located at 1037 E Front St, Bloomington, IL 61701 and is currently estimated at $131,868, approximately $76 per square foot. 1037 E Front St is a home located in McLean County with nearby schools including Washington Elementary School, Bloomington Junior High School, and Bloomington High School.
Ownership History
Date
Name
Owned For
Owner Type
Purchase Details
Closed on
Dec 31, 2024
Sold by
Jcss Holdings Llc
Bought by
J2cs Properties Llc
Current Estimated Value
Home Financials for this Owner
Home Financials are based on the most recent Mortgage that was taken out on this home.
Original Mortgage
$101,164
Outstanding Balance
$89,584
Interest Rate
6.84%
Mortgage Type
New Conventional
Estimated Equity
$42,284
Purchase Details
Closed on
Jun 16, 2017
Sold by
Barbeu Kimberly A
Bought by
Jcss Holdings Llc
Home Financials for this Owner
Home Financials are based on the most recent Mortgage that was taken out on this home.
Original Mortgage
$125,800
Interest Rate
3.94%
Purchase Details
Closed on
Feb 15, 2005
Sold by
Adame Jennifer and Adame Vicente
Bought by
Barbeau Kimberly
Home Financials for this Owner
Home Financials are based on the most recent Mortgage that was taken out on this home.
Original Mortgage
$82,600
Interest Rate
5.8%
Create a Home Valuation Report for This Property
The Home Valuation Report is an in-depth analysis detailing your home's value as well as a comparison with similar homes in the area
Home Values in the Area
Average Home Value in this Area
Purchase History
| Date | Buyer | Sale Price | Title Company |
|---|---|---|---|
| J2cs Properties Llc | -- | None Listed On Document | |
| J2cs Properties Llc | -- | None Listed On Document | |
| Jcss Holdings Llc | $74,000 | None Available | |
| Barbeau Kimberly | $87,000 | None Available |
Source: Public Records
Mortgage History
| Date | Status | Borrower | Loan Amount |
|---|---|---|---|
| Open | J2cs Properties Llc | $101,164 | |
| Closed | J2cs Properties Llc | $101,164 | |
| Previous Owner | Jcss Holdings Llc | $125,800 | |
| Previous Owner | Barbeau Kimberly | $82,600 |
Source: Public Records
Tax History
| Year | Tax Paid | Tax Assessment Tax Assessment Total Assessment is a certain percentage of the fair market value that is determined by local assessors to be the total taxable value of land and additions on the property. | Land | Improvement |
|---|---|---|---|---|
| 2024 | $2,871 | $39,245 | $10,795 | $28,450 |
| 2022 | $2,871 | $33,785 | $9,294 | $24,491 |
| 2021 | $2,699 | $31,763 | $8,738 | $23,025 |
| 2020 | $2,692 | $31,763 | $8,738 | $23,025 |
| 2019 | $2,684 | $31,763 | $8,738 | $23,025 |
| 2018 | $2,621 | $31,141 | $8,567 | $22,574 |
| 2017 | $2,117 | $31,141 | $8,567 | $22,574 |
| 2016 | $2,113 | $31,141 | $8,567 | $22,574 |
| 2015 | $2,072 | $30,730 | $8,454 | $22,276 |
| 2014 | $1,984 | $30,453 | $8,454 | $21,999 |
| 2013 | -- | $29,856 | $8,288 | $21,568 |
Source: Public Records
Map
Nearby Homes
- 1111 E Jefferson St Unit 1
- 203 Denver St
- 222 Leland St
- 1007 E Jefferson St
- 813 E Taylor St
- 802 E Grove St
- 806 E Monroe St
- 610 E Mulberry St
- 819 Bell St
- 611 Vale St
- 1510 E Olive St
- 1926 E Oakland Ave
- 503 S Evans St
- 501 E Mulberry St
- 814 W Mill St
- 307 S Mclean St
- 511 E Chestnut St
- 410 N Mclean St
- 101 N Bellemont Rd
- 304 S Prairie St
- 103 S State St
- 1035 E Front St
- 101 S State St
- 105 S State St
- 1033 E Front St
- 1120 E Grove St
- 102 N State St
- 1122 E Grove St
- 1116 E Grove St
- 1031 E Front St
- 104 S State St
- 1202 E Grove St
- 1114 E Grove St
- 1028 E Front St
- 1029 E Front St
- 1112 E Grove St
- 1204 E Grove St
- 1026 1/2 E Front St
- 1027 E Front St
- 1206 E Grove St
Your Personal Tour Guide
Ask me questions while you tour the home.