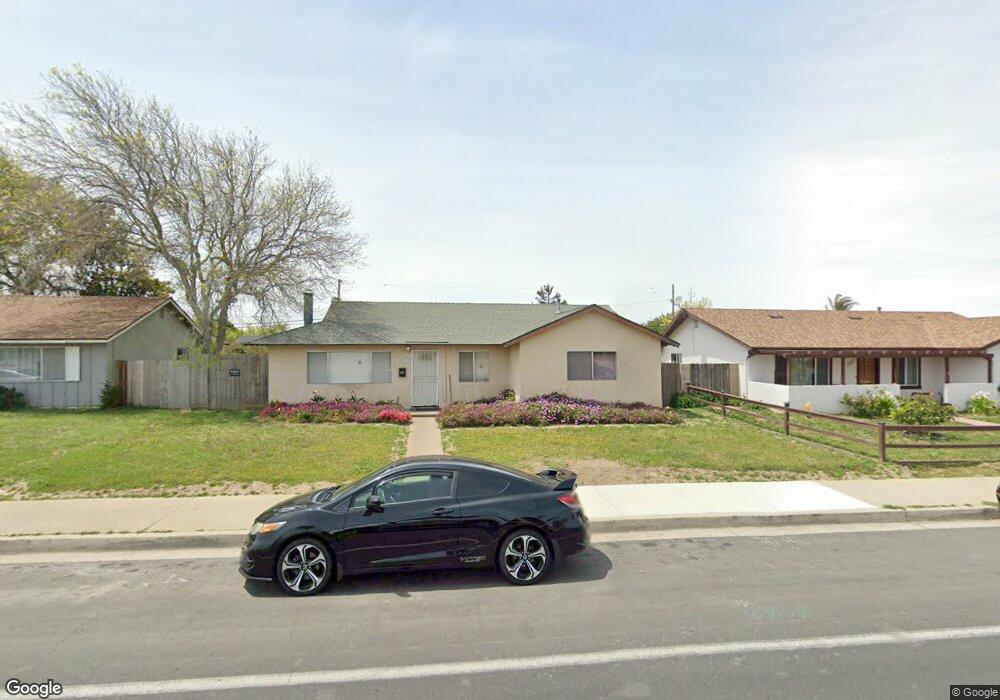
1037 N O St Lompoc, CA 93436
Estimated Value: $517,000 - $621,000
4
Beds
2
Baths
1,326
Sq Ft
$434/Sq Ft
Est. Value
About This Home
This home is located at 1037 N O St, Lompoc, CA 93436 and is currently estimated at $575,012, approximately $433 per square foot. 1037 N O St is a home located in Santa Barbara County with nearby schools including La Canada Elementary School, Lompoc Valley Middle School, and Lompoc High School.
Ownership History
Date
Name
Owned For
Owner Type
Purchase Details
Closed on
Nov 30, 2023
Sold by
Xiong May
Bought by
May Xiong Revocable Living Trust and Xiong
Current Estimated Value
Purchase Details
Closed on
May 11, 2012
Sold by
Xiong Cha and Xiong May Houa
Bought by
Xiong Chuchee and Xiong May Houa
Purchase Details
Closed on
Sep 14, 2001
Sold by
Xiong Vang Cheu and Xiong Kao Yang
Bought by
Xiong Cha and Xiong May Houa
Purchase Details
Closed on
Aug 11, 1994
Sold by
Xiong Yer
Bought by
Xiong Vang Cheu and Xiong Kao Yang
Home Financials for this Owner
Home Financials are based on the most recent Mortgage that was taken out on this home.
Original Mortgage
$108,000
Interest Rate
7.5%
Create a Home Valuation Report for This Property
The Home Valuation Report is an in-depth analysis detailing your home's value as well as a comparison with similar homes in the area
Home Values in the Area
Average Home Value in this Area
Purchase History
We collect this data history from publicly available records. To have your information removed, we recommend requesting removal directly through your county’s website.
| Date | Buyer | Sale Price | Title Company |
|---|---|---|---|
| May Xiong Revocable Living Trust | -- | None Listed On Document | |
| Xiong May | -- | None Listed On Document | |
| Xiong Chuchee | -- | None Available | |
| Xiong Cha | -- | -- | |
| Xiong Vang Cheu | -- | Fidelity National Title Co | |
| Xiong Robert Ger | -- | Fidelity National Title Co |
Source: Public Records
Mortgage History
We collect this data history from publicly available records. To have your information removed, we recommend requesting removal directly through your county’s website.
| Date | Status | Borrower | Loan Amount |
|---|---|---|---|
| Previous Owner | Xiong Vang Cheu | $108,000 |
Source: Public Records
Tax History
| Year | Tax Paid | Tax Assessment Tax Assessment Total Assessment is a certain percentage of the fair market value that is determined by local assessors to be the total taxable value of land and additions on the property. | Land | Improvement |
|---|---|---|---|---|
| 2025 | $2,701 | $245,797 | $99,351 | $146,446 |
| 2023 | $2,701 | $236,254 | $95,494 | $140,760 |
| 2022 | $2,654 | $231,622 | $93,622 | $138,000 |
| 2021 | $2,682 | $227,082 | $91,787 | $135,295 |
| 2020 | $2,654 | $224,754 | $90,846 | $133,908 |
| 2019 | $2,610 | $220,348 | $89,065 | $131,283 |
| 2018 | $2,570 | $216,028 | $87,319 | $128,709 |
| 2017 | $2,523 | $211,793 | $85,607 | $126,186 |
| 2016 | $2,477 | $207,641 | $83,929 | $123,712 |
| 2014 | $2,335 | $193,000 | $77,000 | $116,000 |
Source: Public Records
Map
Nearby Homes
- 923 N N Place
- 1213 Iris Ct
- 1257 Stonebrook Dr
- 1249 Westbrook Dr
- 1248 Stonebrook Dr
- 1309 Stonebrook Dr
- 1444 Village Meadows Dr
- 1308 Jason Dr
- 1340 Jason Dr
- 1513 W Lemon Ave
- 904 W College Ave
- 1116 N Y St
- 1407 N H St
- 526 N L St
- 100 California 1
- 1504 W Airport Ave
- 516 N U St
- 921 N Z St
- 1621 W Pine Ave
- 1344 N G St
Your Personal Tour Guide
Ask me questions while you tour the home.