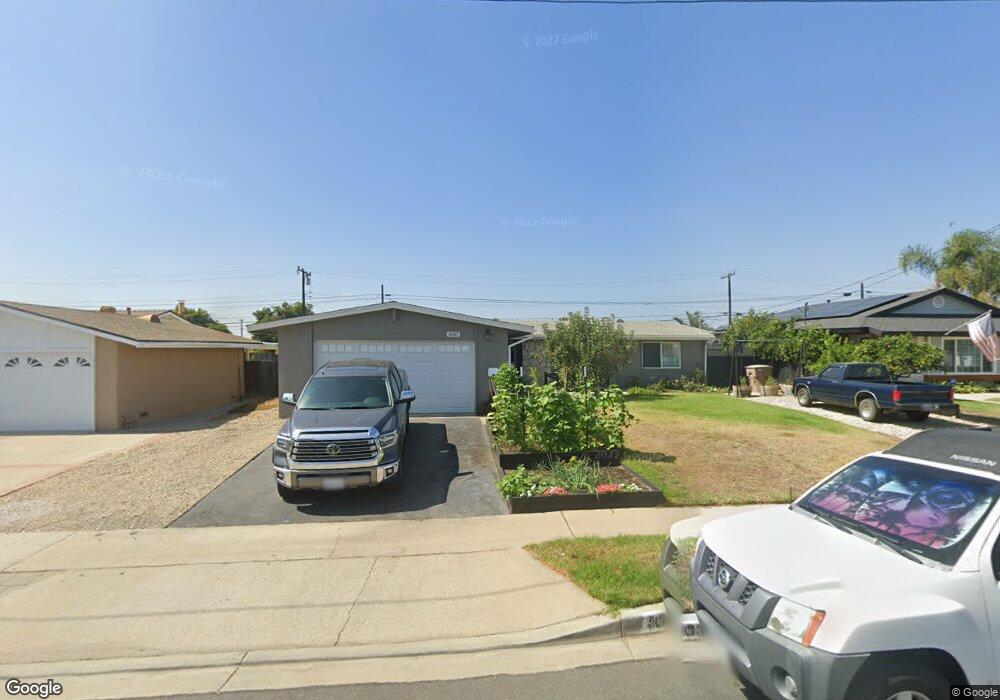
1037 Skeel Dr Camarillo, CA 93010
Estimated Value: $817,000 - $1,007,000
3
Beds
2
Baths
1,310
Sq Ft
$682/Sq Ft
Est. Value
About This Home
This home is located at 1037 Skeel Dr, Camarillo, CA 93010 and is currently estimated at $892,894, approximately $681 per square foot. 1037 Skeel Dr is a home located in Ventura County with nearby schools including Monte Vista Middle School, Camarillo Academy of Progressive Education, and University Preparation Charter School at CSU Channel Islands.
Ownership History
Date
Name
Owned For
Owner Type
Purchase Details
Closed on
Mar 28, 2018
Sold by
Smith Jeffery M and Smith Tonya L
Bought by
Smith Jeffrey M and Smith Tohya L
Current Estimated Value
Purchase Details
Closed on
May 18, 2017
Sold by
Smith Jeffrey M and Smith Tonya L
Bought by
Smith Jeffrey M and Smith Tonya L
Home Financials for this Owner
Home Financials are based on the most recent Mortgage that was taken out on this home.
Original Mortgage
$320,000
Outstanding Balance
$217,366
Interest Rate
4.1%
Mortgage Type
New Conventional
Estimated Equity
$675,528
Purchase Details
Closed on
Nov 5, 1997
Sold by
Nee Glenn L and Lou Emma
Bought by
Smith Jeffery M and Smith Tonya L
Home Financials for this Owner
Home Financials are based on the most recent Mortgage that was taken out on this home.
Original Mortgage
$183,600
Interest Rate
7.26%
Mortgage Type
VA
Create a Home Valuation Report for This Property
The Home Valuation Report is an in-depth analysis detailing your home's value as well as a comparison with similar homes in the area
Home Values in the Area
Average Home Value in this Area
Purchase History
| Date | Buyer | Sale Price | Title Company |
|---|---|---|---|
| Smith Jeffrey M | -- | None Available | |
| Smth Jeffrey M | -- | None Available | |
| Smith Jeffrey M | -- | Orange Coast Title Company | |
| Smith Jeffery M | $180,000 | Progressive Title Company |
Source: Public Records
Mortgage History
| Date | Status | Borrower | Loan Amount |
|---|---|---|---|
| Open | Smith Jeffrey M | $320,000 | |
| Closed | Smith Jeffery M | $183,600 |
Source: Public Records
Tax History Compared to Growth
Tax History
| Year | Tax Paid | Tax Assessment Tax Assessment Total Assessment is a certain percentage of the fair market value that is determined by local assessors to be the total taxable value of land and additions on the property. | Land | Improvement |
|---|---|---|---|---|
| 2025 | $3,142 | $287,382 | $114,949 | $172,433 |
| 2024 | $3,142 | $281,748 | $112,696 | $169,052 |
| 2023 | $3,029 | $276,224 | $110,486 | $165,738 |
| 2022 | $3,018 | $270,808 | $108,319 | $162,489 |
| 2021 | $2,910 | $265,499 | $106,196 | $159,303 |
| 2020 | $2,898 | $262,778 | $105,108 | $157,670 |
| 2019 | $2,883 | $257,627 | $103,048 | $154,579 |
| 2018 | $2,829 | $252,577 | $101,028 | $151,549 |
| 2017 | $2,664 | $247,626 | $99,048 | $148,578 |
| 2016 | $2,600 | $242,771 | $97,106 | $145,665 |
| 2015 | $2,571 | $239,127 | $95,649 | $143,478 |
| 2014 | $2,511 | $234,444 | $93,776 | $140,668 |
Source: Public Records
Map
Nearby Homes
- 1075 Seybolt Ave
- 860 Big Horn Ct
- 858 Calle Portilla
- 813 N Calle Circulo
- 1665 Avenida Soltura
- 405 Paseo Del Valle
- 800 Calle Higuera
- 729 Mardigras Ct
- 1566 Edgemont Dr
- 51 Calle Escalon
- 61 Paseo Esplendido
- 1974 Sierra Mesa Dr
- 73 Paseo Esplendido
- 174 Gardenia Ave
- 106 Calle Bella Vista
- 1519 Lyndhurst Ave
- 166 Bramble Ct
- 124 Reddington Ct
- 2048 Sierra Mesa Dr
- 1265 Bedford Dr
- 1013 Skeel Dr
- 1065 Skeel Dr
- 1042 Rosewood Ave
- 1058 Rosewood Ave
- 1087 Skeel Dr
- 991 Skeel Dr
- 1024 Rosewood Ave
- 1074 Rosewood Ave
- 1024 Skeel Dr
- 1052 Skeel Dr
- 1111 Skeel Dr
- 971 Skeel Dr
- 1076 Skeel Dr
- 1008 Rosewood Ave
- 1090 Rosewood Ave
- 980 Skeel Dr
- 1104 Skeel Dr
- 1131 Skeel Dr
- 990 Rosewood Ave
- 967 Skeel Dr