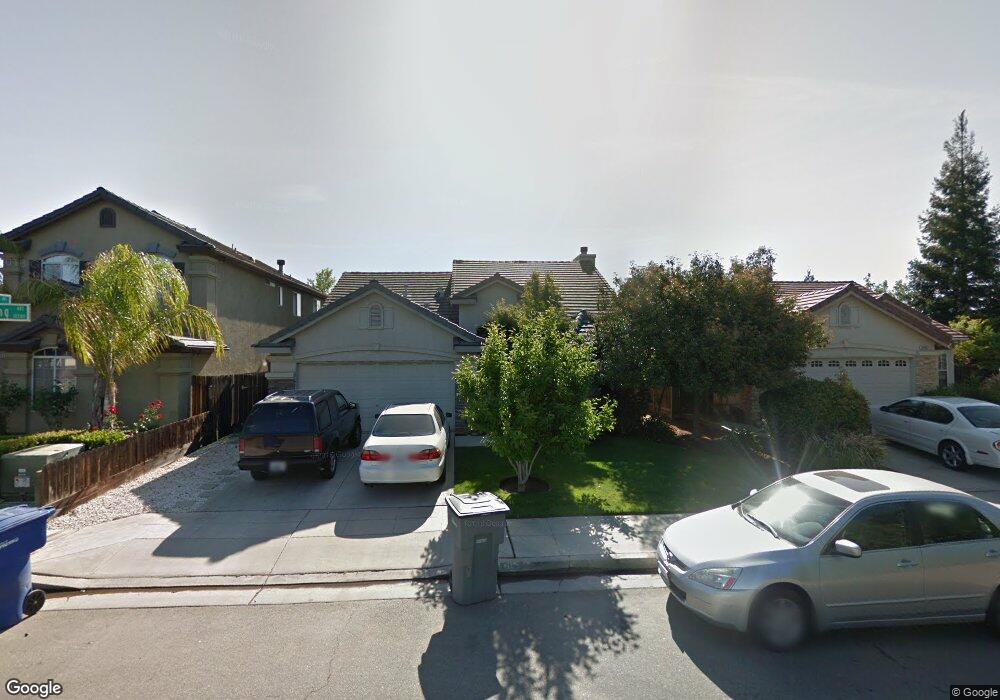
10372 N Dearing Ave Fresno, CA 93730
Woodward Park NeighborhoodEstimated Value: $440,178 - $488,000
3
Beds
2
Baths
1,613
Sq Ft
$286/Sq Ft
Est. Value
About This Home
This home is located at 10372 N Dearing Ave, Fresno, CA 93730 and is currently estimated at $461,295, approximately $285 per square foot. 10372 N Dearing Ave is a home located in Fresno County with nearby schools including Copper Hills Elementary School, Granite Ridge Intermediate School, and Clovis North High School.
Ownership History
Date
Name
Owned For
Owner Type
Purchase Details
Closed on
Nov 20, 2008
Sold by
Morales Steven Anthony
Bought by
Morales Marilu Lonnette
Current Estimated Value
Home Financials for this Owner
Home Financials are based on the most recent Mortgage that was taken out on this home.
Original Mortgage
$191,900
Outstanding Balance
$119,979
Interest Rate
5.14%
Mortgage Type
FHA
Estimated Equity
$341,316
Purchase Details
Closed on
Aug 26, 2005
Sold by
Morales Marilu Lonnette
Bought by
Morales Marilu Lonnette
Purchase Details
Closed on
Mar 3, 1998
Sold by
Westcal Inc
Bought by
Morales Steven Anthony and Morales Marilu Lonnette
Home Financials for this Owner
Home Financials are based on the most recent Mortgage that was taken out on this home.
Original Mortgage
$122,086
Interest Rate
7.15%
Mortgage Type
FHA
Create a Home Valuation Report for This Property
The Home Valuation Report is an in-depth analysis detailing your home's value as well as a comparison with similar homes in the area
Home Values in the Area
Average Home Value in this Area
Purchase History
| Date | Buyer | Sale Price | Title Company |
|---|---|---|---|
| Morales Marilu Lonnette | -- | Fidelity National Title Co | |
| Morales Marilu Lonnette | -- | -- | |
| Morales Steven Anthony | $123,500 | Chicago Title Co |
Source: Public Records
Mortgage History
| Date | Status | Borrower | Loan Amount |
|---|---|---|---|
| Open | Morales Marilu Lonnette | $191,900 | |
| Previous Owner | Morales Steven Anthony | $122,086 |
Source: Public Records
Tax History Compared to Growth
Tax History
| Year | Tax Paid | Tax Assessment Tax Assessment Total Assessment is a certain percentage of the fair market value that is determined by local assessors to be the total taxable value of land and additions on the property. | Land | Improvement |
|---|---|---|---|---|
| 2025 | $4,269 | $196,852 | $67,048 | $129,804 |
| 2023 | $4,216 | $189,210 | $64,446 | $124,764 |
| 2022 | $4,178 | $185,501 | $63,183 | $122,318 |
| 2021 | $4,100 | $181,865 | $61,945 | $119,920 |
| 2020 | $4,042 | $180,001 | $61,310 | $118,691 |
| 2019 | $4,030 | $176,472 | $60,108 | $116,364 |
| 2018 | $3,951 | $173,013 | $58,930 | $114,083 |
| 2017 | $2,101 | $169,622 | $57,775 | $111,847 |
| 2016 | $1,974 | $166,297 | $56,643 | $109,654 |
| 2015 | $1,940 | $163,800 | $55,793 | $108,007 |
| 2014 | $1,904 | $160,593 | $54,701 | $105,892 |
Source: Public Records
Map
Nearby Homes
- 10612 N Dearing Ave
- 10213 N Recreation Ave
- 2537 E Prestwick Ave
- 0 E Behymer Ave
- 2146 E Sawgrass Ave
- 10033 N Baird Ave
- 2096 E Olympic Ave
- 2136 E Royal Dornoch Ave
- 2322 E Revere Rd
- 2749 E Tamarind Dr
- 2789 E Tamarind Dr
- 2815 E Colina Dr
- 2827 E Colina Dr
- 10152 N Meridian Ave
- 9812 N Sedona Cir
- 2445 E Copper Hill Way
- 10551 N Jackson Ave
- 2913 E Escarpa Dr
- 2037 Christensen Dr
- 2020 Makenna Dr
- 10382 N Dearing Ave
- 10362 N Dearing Ave
- 10392 N Dearing Ave
- 10404 N Dearing Ave
- 2455 E Emilie Ave
- 2458 E Emilie Ave
- 10342 N Dearing Ave
- 10414 N Dearing Ave
- 2448 E Emilie Ave
- 2445 E Emilie Ave
- 2458 E Fox Glen Ave
- 2449 E Carter Ave
- 10424 N Dearing Ave
- 10332 N Dearing Ave
- 2438 E Emilie Ave
- 2450 E Fox Glen Ave
- 2435 E Emilie Ave
- 2439 E Carter Ave
- 10434 N Dearing Ave
- 2442 E Fox Glen Ave