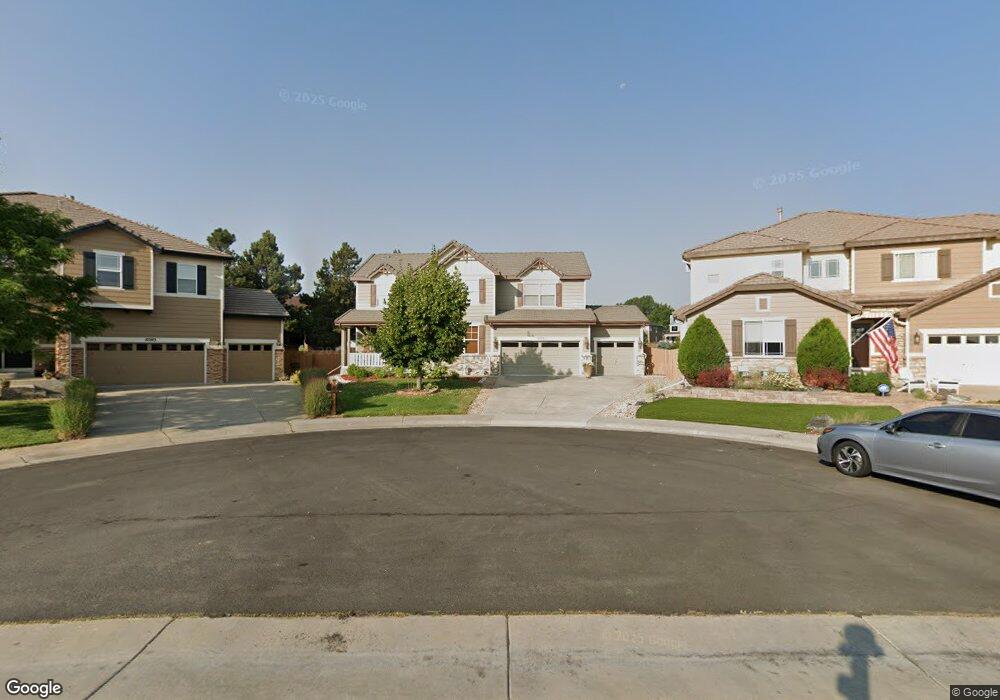
10379 Knollside Dr Parker, CO 80134
Estimated Value: $734,000 - $793,000
4
Beds
3
Baths
2,863
Sq Ft
$269/Sq Ft
Est. Value
About This Home
This home is located at 10379 Knollside Dr, Parker, CO 80134 and is currently estimated at $768,904, approximately $268 per square foot. 10379 Knollside Dr is a home located in Douglas County with nearby schools including Cherokee Trail Elementary School, Sierra Middle School, and Chaparral High School.
Ownership History
Date
Name
Owned For
Owner Type
Purchase Details
Closed on
Dec 23, 2011
Sold by
Stevenson Mark J
Bought by
Stevenson Mark J and Stevenson Coral L
Current Estimated Value
Home Financials for this Owner
Home Financials are based on the most recent Mortgage that was taken out on this home.
Original Mortgage
$370,063
Outstanding Balance
$40,059
Interest Rate
4.03%
Mortgage Type
FHA
Estimated Equity
$728,845
Purchase Details
Closed on
May 30, 2006
Sold by
Richmond American Homes Of Colorado Inc
Bought by
Stevenson Mark J
Home Financials for this Owner
Home Financials are based on the most recent Mortgage that was taken out on this home.
Original Mortgage
$295,800
Interest Rate
7.12%
Mortgage Type
Fannie Mae Freddie Mac
Purchase Details
Closed on
Oct 21, 2003
Sold by
Kb Home Colorado Inc
Bought by
Richmond American Homes Of Co Inc
Purchase Details
Closed on
Apr 30, 2002
Sold by
Cottrell Lynn
Bought by
Kb Home Colorado Inc
Create a Home Valuation Report for This Property
The Home Valuation Report is an in-depth analysis detailing your home's value as well as a comparison with similar homes in the area
Home Values in the Area
Average Home Value in this Area
Purchase History
| Date | Buyer | Sale Price | Title Company |
|---|---|---|---|
| Stevenson Mark J | -- | First American | |
| Stevenson Mark J | $369,800 | None Available | |
| Richmond American Homes Of Co Inc | $4,958,000 | -- | |
| Kb Home Colorado Inc | $1,082,500 | -- |
Source: Public Records
Mortgage History
| Date | Status | Borrower | Loan Amount |
|---|---|---|---|
| Open | Stevenson Mark J | $370,063 | |
| Closed | Stevenson Mark J | $295,800 |
Source: Public Records
Tax History Compared to Growth
Tax History
| Year | Tax Paid | Tax Assessment Tax Assessment Total Assessment is a certain percentage of the fair market value that is determined by local assessors to be the total taxable value of land and additions on the property. | Land | Improvement |
|---|---|---|---|---|
| 2024 | $4,355 | $53,550 | $10,840 | $42,710 |
| 2023 | $4,408 | $53,550 | $10,840 | $42,710 |
| 2022 | $3,153 | $36,470 | $7,060 | $29,410 |
| 2021 | $3,282 | $36,470 | $7,060 | $29,410 |
| 2020 | $3,161 | $35,710 | $5,360 | $30,350 |
| 2019 | $3,181 | $35,710 | $5,360 | $30,350 |
| 2018 | $2,856 | $31,250 | $6,110 | $25,140 |
| 2017 | $2,650 | $31,250 | $6,110 | $25,140 |
| 2016 | $2,571 | $29,760 | $4,460 | $25,300 |
| 2015 | $2,618 | $29,760 | $4,460 | $25,300 |
| 2014 | $2,720 | $27,570 | $4,330 | $23,240 |
Source: Public Records
Map
Nearby Homes
- 10371 Knollside Dr
- 17071 Knollside Ave
- 10414 Stonewillow Dr
- 11626 Masonville Dr
- 11613 Masonville Dr
- 17130 Opal Hill Dr
- 17109 Campion Way
- 10251 Hedge Ln
- 16745 Rockledge Cove
- 16642 Autumn Rock Cove
- 10505 Berthoud Way
- 17235 Opal Hill Dr
- 17351 Cornerstone Dr
- 10318 Severance Dr
- 17046 Wellington Dr
- 16382 Maple Rock Ct
- 10607 Clarke Farms Dr
- 16341 Maple Rock Ct
- 16641 Martingale Dr
- 10721 Kimball St
- 10383 Knollside Dr
- 17001 Lamar Dr
- 17038 Knollside Ave
- 17003 Lamar Dr
- 11649 Masonville Dr
- 17005 Lamar Dr
- 17048 Knollside Ave
- 17007 Lamar Dr
- 11647 Masonville Dr
- 17041 Knollside Ave
- 17009 Lamar Dr
- 17058 Knollside Ave
- 10363 Knollside Dr
- 17051 Knollside Ave
- 11645 Masonville Dr
- 17002 Lamar Dr
- 10394 Longleaf Dr
- 10402 Longleaf Dr
- 17011 Lamar Dr
- 17004 Lamar Dr