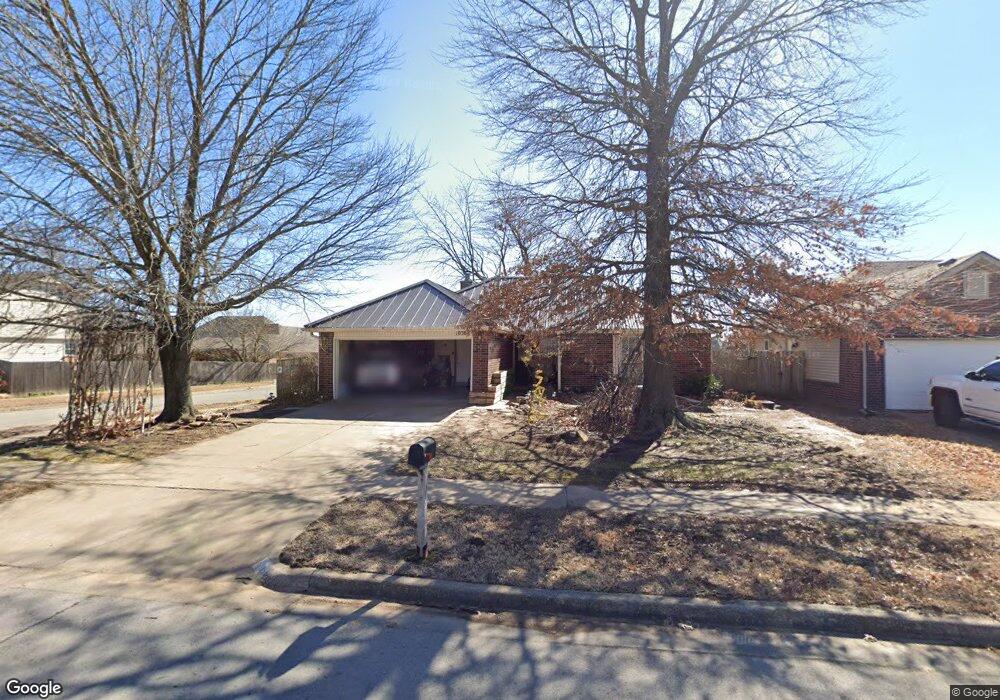
1038 E 133rd St Glenpool, OK 74033
Estimated Value: $210,489 - $233,000
3
Beds
2
Baths
1,267
Sq Ft
$175/Sq Ft
Est. Value
About This Home
This home is located at 1038 E 133rd St, Glenpool, OK 74033 and is currently estimated at $221,872, approximately $175 per square foot. 1038 E 133rd St is a home located in Tulsa County with nearby schools including Glenpool Elementary School, Glenpool Middle School, and Glenpool High School.
Ownership History
Date
Name
Owned For
Owner Type
Purchase Details
Closed on
Feb 29, 2008
Sold by
Tanksley Joseph R and Tanksley Melonie A
Bought by
Bryan Karen S and Bryan Gregory A
Current Estimated Value
Home Financials for this Owner
Home Financials are based on the most recent Mortgage that was taken out on this home.
Original Mortgage
$73,000
Interest Rate
5.47%
Mortgage Type
Purchase Money Mortgage
Purchase Details
Closed on
Nov 15, 2004
Sold by
Kelpin Judy L and Kelpin Wayne
Bought by
Tanksley Joseph R and Tanksley Melonie A
Home Financials for this Owner
Home Financials are based on the most recent Mortgage that was taken out on this home.
Original Mortgage
$81,236
Interest Rate
5.71%
Mortgage Type
Purchase Money Mortgage
Purchase Details
Closed on
Dec 30, 2002
Sold by
Busby Alvin Charles
Bought by
Busby Judy Lenora
Create a Home Valuation Report for This Property
The Home Valuation Report is an in-depth analysis detailing your home's value as well as a comparison with similar homes in the area
Home Values in the Area
Average Home Value in this Area
Purchase History
| Date | Buyer | Sale Price | Title Company |
|---|---|---|---|
| Bryan Karen S | $113,000 | Frisco Title Corporation | |
| Tanksley Joseph R | $102,000 | -- | |
| Busby Judy Lenora | -- | -- |
Source: Public Records
Mortgage History
| Date | Status | Borrower | Loan Amount |
|---|---|---|---|
| Closed | Bryan Karen S | $73,000 | |
| Previous Owner | Tanksley Joseph R | $81,236 | |
| Closed | Tanksley Joseph R | $20,309 |
Source: Public Records
Tax History
| Year | Tax Paid | Tax Assessment Tax Assessment Total Assessment is a certain percentage of the fair market value that is determined by local assessors to be the total taxable value of land and additions on the property. | Land | Improvement |
|---|---|---|---|---|
| 2025 | $1,708 | $14,249 | $1,579 | $12,670 |
| 2024 | $1,566 | $13,805 | $1,570 | $12,235 |
| 2023 | $1,566 | $14,374 | $1,713 | $12,661 |
| 2022 | $1,493 | $12,955 | $2,006 | $10,949 |
| 2021 | $1,468 | $12,548 | $1,943 | $10,605 |
| 2020 | $1,479 | $12,548 | $1,943 | $10,605 |
| 2019 | $1,490 | $12,548 | $1,943 | $10,605 |
| 2018 | $1,483 | $12,548 | $1,943 | $10,605 |
| 2017 | $1,451 | $13,548 | $2,098 | $11,450 |
| 2016 | $1,466 | $13,548 | $2,098 | $11,450 |
| 2015 | $1,416 | $13,548 | $2,098 | $11,450 |
| 2014 | $1,378 | $13,548 | $2,098 | $11,450 |
Source: Public Records
Map
Nearby Homes
- 13294 S Maple St
- 1171 E 133rd St
- 1218 E 133rd Place
- 1211 E 135th St
- 13324 S Poplar St
- 13674 S Maple St
- 1104 E 137th St
- 13653 S Hickory Place
- 582 E 133rd Place
- 13796 S Nyssa Place
- 13761 S Nyssa Ct
- 603 E 135th Place
- 2355 E 135th Place
- 13773 S Oak Place
- 13659 S Quincy St
- 1664 E 138th St S
- 1671 E 140th St
- 1543 E 137th Place
- 243 E 141st St
- 13672 S Kenosha Ave
- 1026 E 133rd St
- 1009 E 133rd Place
- 1050 E 133rd St
- 1014 E 133rd St
- 1015 E 133rd St
- 1027 E 133rd St
- 1101 E 133rd Place
- 1062 E 133rd St
- 1005 E 133rd Place
- 1039 E 133rd St
- 1002 E 133rd St
- 1051 E 133rd St
- 1063 E 133rd St
- 13282 S Maple St
- 13321 S Maple St
- 1016 E 132nd Place
- 13323 S Maple St
- 1040 E 132nd Place
- 1086 E 133rd St
- 1109 E 133rd Place
Your Personal Tour Guide
Ask me questions while you tour the home.