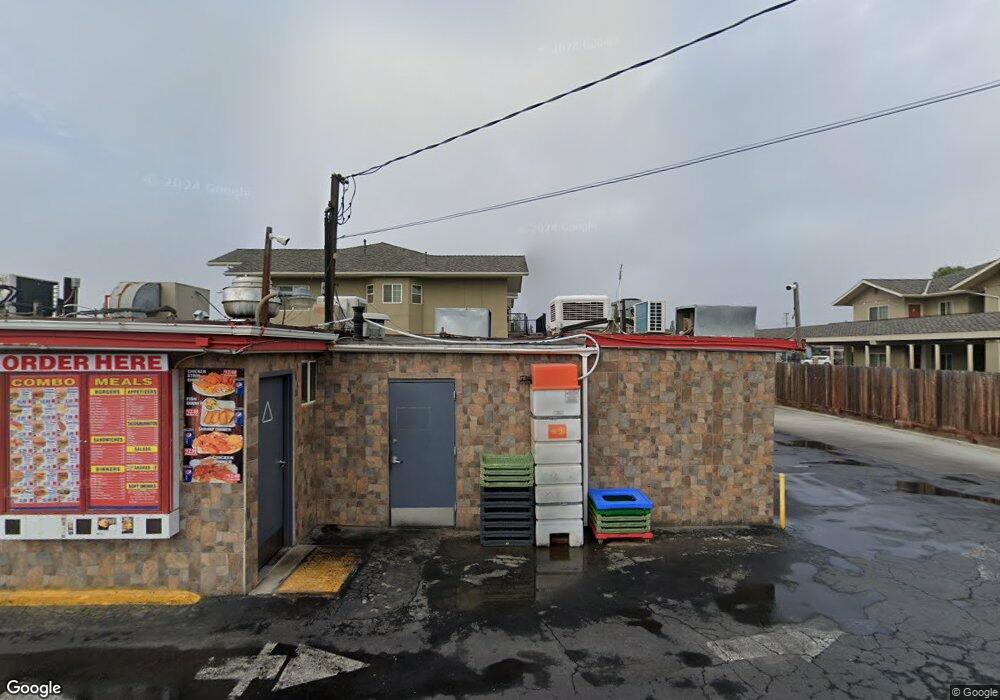
1038 W Inyo Ave Tulare, CA 93274
Estimated Value: $116,723
Studio
2
Baths
661
Sq Ft
$177/Sq Ft
Est. Value
About This Home
This home is located at 1038 W Inyo Ave, Tulare, CA 93274 and is currently estimated at $116,723, approximately $176 per square foot. 1038 W Inyo Ave is a home located in Tulare County with nearby schools including Maple Elementary School, Mulcahy Middle School, and Tulare Western High School.
Ownership History
Date
Name
Owned For
Owner Type
Purchase Details
Closed on
Mar 2, 2016
Sold by
Althari Arwa
Bought by
Hasson Sadeq M
Current Estimated Value
Purchase Details
Closed on
Mar 1, 2016
Sold by
Obeid Saleh N
Bought by
Hasson Sadeq M and Ahmed Mohamed Mohsen
Purchase Details
Closed on
Aug 2, 2004
Sold by
Jashan Nima S
Bought by
Obeid Saleh N
Purchase Details
Closed on
Aug 13, 2003
Sold by
Barraza Cosme G
Bought by
Obeid Saleh N
Home Financials for this Owner
Home Financials are based on the most recent Mortgage that was taken out on this home.
Original Mortgage
$75,000
Interest Rate
6.24%
Mortgage Type
Commercial
Purchase Details
Closed on
May 3, 1995
Sold by
Quinonez Isaac S and Quinonez Mary M
Bought by
Barraza Cosme G
Home Financials for this Owner
Home Financials are based on the most recent Mortgage that was taken out on this home.
Original Mortgage
$15,000
Interest Rate
8.51%
Mortgage Type
Seller Take Back
Create a Home Valuation Report for This Property
The Home Valuation Report is an in-depth analysis detailing your home's value as well as a comparison with similar homes in the area
Home Values in the Area
Average Home Value in this Area
Purchase History
| Date | Buyer | Sale Price | Title Company |
|---|---|---|---|
| Hasson Sadeq M | -- | Chicago Title Company | |
| Hasson Sadeq M | $70,000 | Chicago Title Company | |
| Obeid Saleh N | -- | Fidelity National Title Co | |
| Obeid Saleh N | $98,000 | Fidelity National Title Co | |
| Barraza Cosme G | $90,000 | Fidelity National Title |
Source: Public Records
Mortgage History
| Date | Status | Borrower | Loan Amount |
|---|---|---|---|
| Previous Owner | Obeid Saleh N | $75,000 | |
| Previous Owner | Barraza Cosme G | $15,000 | |
| Closed | Barraza Cosme G | $10,000 |
Source: Public Records
Tax History
| Year | Tax Paid | Tax Assessment Tax Assessment Total Assessment is a certain percentage of the fair market value that is determined by local assessors to be the total taxable value of land and additions on the property. | Land | Improvement |
|---|---|---|---|---|
| 2025 | $1,417 | $130,214 | $65,107 | $65,107 |
| 2024 | $1,417 | $127,662 | $63,831 | $63,831 |
| 2023 | $1,381 | $125,160 | $62,580 | $62,580 |
| 2022 | $1,341 | $122,706 | $61,353 | $61,353 |
| 2021 | $1,324 | $120,300 | $60,150 | $60,150 |
| 2020 | $1,346 | $119,066 | $59,533 | $59,533 |
| 2019 | $1,380 | $116,732 | $58,366 | $58,366 |
| 2018 | $1,358 | $114,444 | $57,222 | $57,222 |
| 2017 | $1,345 | $112,200 | $56,100 | $56,100 |
| 2016 | $1,349 | $115,396 | $35,326 | $80,070 |
| 2015 | $1,326 | $113,662 | $34,795 | $78,867 |
| 2014 | $1,304 | $111,435 | $34,113 | $77,322 |
Source: Public Records
Map
Nearby Homes
- 947 W Kern Ave
- 129 S C St
- 428 Napa St
- 1141 W San Joaquin Ave
- 537 S Los Angeles St
- 1112 W San Joaquin Ave
- 707 W Sonora Ave
- 234 S D St
- 748 S Walter St
- 645 Bravery St
- 257 N F St
- 160 White St
- 1683 Union Ave
- 1708 Union Ave
- 348 N F St
- 1732 Union Ave
- 1744 Union Ave
- 605 Catalina Cir
- 1738 Justice Ave
- 1753 Union Ave
- 1042 W Inyo Ave
- 249 S California St
- 232 S Sacramento St
- 237 S California St
- 225 S California St
- 1105 W Inyo Ave
- 1120 W Inyo Ave
- 245 S Sacramento St
- 217 S California St
- 1135 W Inyo Ave
- 233 S Sacramento St
- 1100 W Inyo Ave
- 225 S Sacramento St
- 250 S California St
- 211 S California St
- 1112 W Inyo Ave
- 236 S California St
- 944 W Inyo Ave
- 328 S Sacramento St
- 217 S Sacramento St
Your Personal Tour Guide
Ask me questions while you tour the home.