
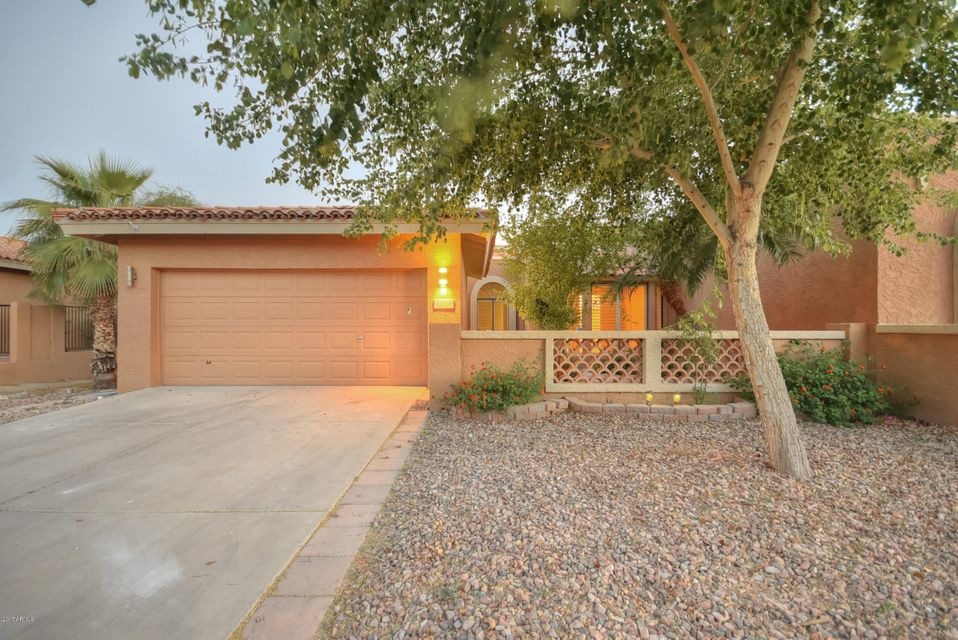
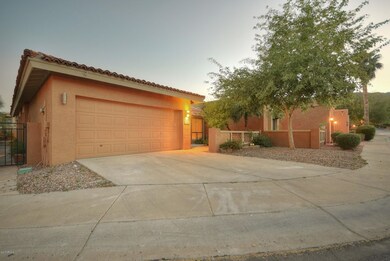
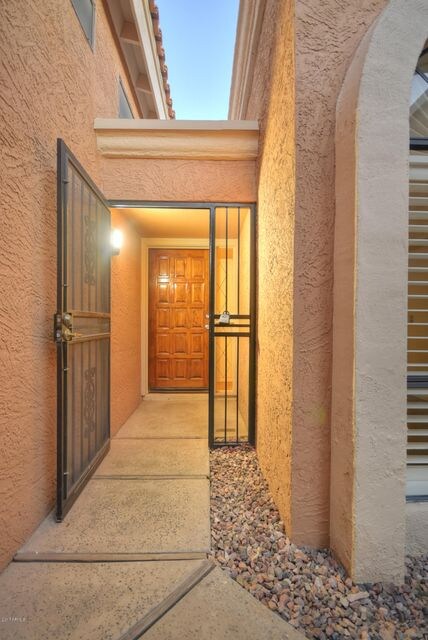
1039 E Desert Cove Ave Phoenix, AZ 85020
North Mountain Village Neighborhood
3
Beds
2
Baths
1,746
Sq Ft
4,409
Sq Ft Lot
Highlights
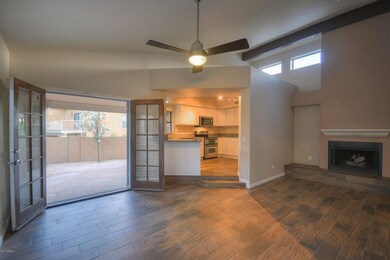
- 1 Fireplace
- Heated Community Pool
- Dual Vanity Sinks in Primary Bathroom
- Shadow Mountain High School Rated A-
- Eat-In Kitchen
- Wrought Iron Fence
About This Home
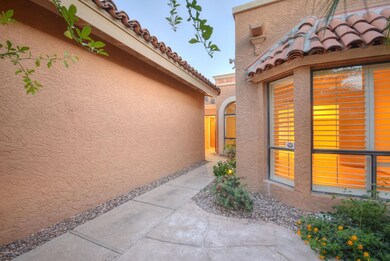
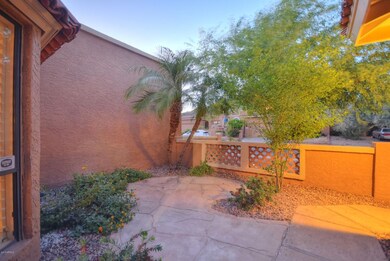
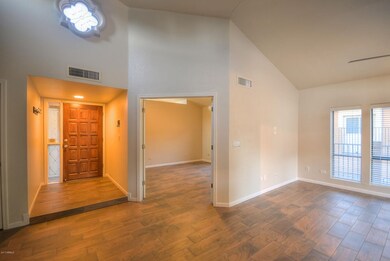
As of July 2022LOCATION LOCATION LOCATION!!! This home is situated in a beautiful mountain side community close to the Pointe Hilton and North Mountain. Newly remodeled kitchen and bathrooms with fresh paint and greenery. This low maintenance home has it all. Come see today !
Last Agent to Sell the Property
My Home Group Real Estate License #SA639785000 Listed on: 05/04/2017
Home Details
Home Type
- Single Family
Est. Annual Taxes
- $2,136
Year Built
- Built in 1988
Lot Details
- 4,409 Sq Ft Lot
- Wrought Iron Fence
- Block Wall Fence
Parking
- 2 Car Garage
Home Design
- Wood Frame Construction
- Composition Roof
- Stucco
Interior Spaces
- 1,746 Sq Ft Home
- 1-Story Property
- 1 Fireplace
- Eat-In Kitchen
Bedrooms and Bathrooms
- 3 Bedrooms
- Primary Bathroom is a Full Bathroom
- 2 Bathrooms
- Dual Vanity Sinks in Primary Bathroom
- Bathtub With Separate Shower Stall
Laundry
- Dryer
- Washer
Schools
- Larkspur Elementary School
- Shea Middle School
- Shadow Mountain High School
Utilities
- Refrigerated Cooling System
- Heating Available
Listing and Financial Details
- Tax Lot 630
- Assessor Parcel Number 159-26-216
Community Details
Overview
- Property has a Home Owners Association
- Pointe Tapatio Association, Phone Number (602) 277-4418
- Pointe Tapatio 8 Lot 605 663 Tr A M Subdivision
Recreation
- Heated Community Pool
Ownership History
Date
Name
Owned For
Owner Type
Purchase Details
Listed on
Jun 4, 2022
Closed on
Jun 13, 2022
Sold by
Doug And Jean Kraemer Trust
Bought by
Tiernon Anne and Tiernon Theodore
Seller's Agent
Holly Waxman
Citiea
Buyer's Agent
Christina Mooney
AZ Brokerage Holdings, LLC
List Price
$550,000
Sold Price
$585,000
Premium/Discount to List
$35,000
6.36%
Current Estimated Value
Home Financials for this Owner
Home Financials are based on the most recent Mortgage that was taken out on this home.
Estimated Appreciation
-$22,075
Avg. Annual Appreciation
-1.69%
Original Mortgage
$385,000
Outstanding Balance
$368,398
Interest Rate
5.09%
Mortgage Type
New Conventional
Estimated Equity
$186,902
Purchase Details
Closed on
Sep 22, 2020
Sold by
Kraemer Douglas M and Kraemer Rae J
Bought by
Kraemer Douglas Michael and Kraemer Rae Jean
Home Financials for this Owner
Home Financials are based on the most recent Mortgage that was taken out on this home.
Original Mortgage
$308,200
Interest Rate
2.9%
Mortgage Type
New Conventional
Purchase Details
Listed on
Apr 11, 2019
Closed on
May 1, 2019
Sold by
Kujawa Kimberly C
Bought by
Doug And Jean Kraemer Trust
Seller's Agent
Jeff Fields
Russ Lyon Sotheby's International Realty
Buyer's Agent
Brian Dunshie
Russ Lyon Sotheby's International Realty
List Price
$385,000
Sold Price
$385,000
Home Financials for this Owner
Home Financials are based on the most recent Mortgage that was taken out on this home.
Avg. Annual Appreciation
6.08%
Original Mortgage
$308,000
Interest Rate
4%
Mortgage Type
New Conventional
Purchase Details
Listed on
Jun 10, 2018
Closed on
Jul 16, 2018
Sold by
Munn Michelle L
Bought by
Kujawa Kimberly C
Seller's Agent
Mary-Lynn Allen
HomeSmart
Buyer's Agent
Holly Azouz
DeLex Realty
List Price
$359,000
Sold Price
$345,000
Premium/Discount to List
-$14,000
-3.9%
Home Financials for this Owner
Home Financials are based on the most recent Mortgage that was taken out on this home.
Avg. Annual Appreciation
15.10%
Original Mortgage
$327,750
Interest Rate
4.5%
Mortgage Type
New Conventional
Purchase Details
Listed on
May 4, 2017
Closed on
Jun 28, 2017
Sold by
Rev D Up Renovations Llc
Bought by
Munn Michelle L
Seller's Agent
Daniel Barraza
My Home Group Real Estate
Buyer's Agent
Mary-Lynn Allen
HomeSmart
List Price
$329,900
Sold Price
$310,000
Premium/Discount to List
-$19,900
-6.03%
Home Financials for this Owner
Home Financials are based on the most recent Mortgage that was taken out on this home.
Avg. Annual Appreciation
10.31%
Original Mortgage
$248,000
Interest Rate
4.02%
Mortgage Type
New Conventional
Purchase Details
Closed on
Apr 16, 2010
Sold by
Vandorpe Marion E
Bought by
Latour Mark Edward and Latour Tiffany Renee
Home Financials for this Owner
Home Financials are based on the most recent Mortgage that was taken out on this home.
Original Mortgage
$155,000
Interest Rate
4.94%
Mortgage Type
VA
Purchase Details
Closed on
Sep 18, 2001
Sold by
Vandorpe John H and Vandorpe Marion E
Bought by
Vandorpe John H and Vandorpe Marion E
Purchase Details
Closed on
Aug 27, 1998
Sold by
Hayes Beth A
Bought by
Vandorpe John H and Vandorpe Marion E
Purchase Details
Closed on
Aug 29, 1996
Sold by
Hayes Gregg H
Bought by
Hayes Beth A
Similar Homes in Phoenix, AZ
Create a Home Valuation Report for This Property
The Home Valuation Report is an in-depth analysis detailing your home's value as well as a comparison with similar homes in the area
Home Values in the Area
Average Home Value in this Area
Purchase History
| Date | Type | Sale Price | Title Company |
|---|---|---|---|
| Warranty Deed | $585,000 | First American Title | |
| Interfamily Deed Transfer | -- | Old Republic Title Agency | |
| Interfamily Deed Transfer | -- | Old Republic Title Agency | |
| Warranty Deed | $385,000 | Chicago Title Agency | |
| Warranty Deed | $345,000 | Wfg National Title Insurance | |
| Warranty Deed | $310,000 | North American Title Company | |
| Warranty Deed | $210,000 | Empire West Title Agency | |
| Interfamily Deed Transfer | -- | -- | |
| Cash Sale Deed | $166,000 | Ati Title Company | |
| Interfamily Deed Transfer | -- | -- |
Source: Public Records
Mortgage History
| Date | Status | Loan Amount | Loan Type |
|---|---|---|---|
| Open | $385,000 | New Conventional | |
| Previous Owner | $308,200 | New Conventional | |
| Previous Owner | $38,461 | Credit Line Revolving | |
| Previous Owner | $308,000 | New Conventional | |
| Previous Owner | $327,750 | New Conventional | |
| Previous Owner | $248,000 | New Conventional | |
| Previous Owner | $155,000 | VA |
Source: Public Records
Property History
| Date | Event | Price | Change | Sq Ft Price |
|---|---|---|---|---|
| 07/15/2022 07/15/22 | Sold | $585,000 | +1.7% | $335 / Sq Ft |
| 06/13/2022 06/13/22 | Pending | -- | -- | -- |
| 06/11/2022 06/11/22 | Price Changed | $574,950 | 0.0% | $329 / Sq Ft |
| 06/09/2022 06/09/22 | Price Changed | $575,000 | +4.5% | $329 / Sq Ft |
| 06/03/2022 06/03/22 | For Sale | $550,000 | +42.9% | $315 / Sq Ft |
| 05/16/2019 05/16/19 | Sold | $385,000 | 0.0% | $221 / Sq Ft |
| 04/15/2019 04/15/19 | Pending | -- | -- | -- |
| 04/11/2019 04/11/19 | For Sale | $385,000 | +11.6% | $221 / Sq Ft |
| 08/03/2018 08/03/18 | Sold | $345,000 | -1.4% | $198 / Sq Ft |
| 06/25/2018 06/25/18 | Pending | -- | -- | -- |
| 06/23/2018 06/23/18 | Price Changed | $350,000 | -2.5% | $200 / Sq Ft |
| 06/10/2018 06/10/18 | For Sale | $359,000 | +15.8% | $206 / Sq Ft |
| 06/30/2017 06/30/17 | Sold | $310,000 | -6.0% | $178 / Sq Ft |
| 06/01/2017 06/01/17 | For Sale | $329,900 | 0.0% | $189 / Sq Ft |
| 05/18/2017 05/18/17 | Pending | -- | -- | -- |
| 05/03/2017 05/03/17 | For Sale | $329,900 | +28.9% | $189 / Sq Ft |
| 04/13/2017 04/13/17 | Sold | $256,000 | -11.7% | $147 / Sq Ft |
| 04/11/2017 04/11/17 | Price Changed | $289,900 | 0.0% | $166 / Sq Ft |
| 03/27/2017 03/27/17 | Pending | -- | -- | -- |
| 03/18/2017 03/18/17 | For Sale | $289,900 | 0.0% | $166 / Sq Ft |
| 03/10/2017 03/10/17 | Pending | -- | -- | -- |
| 03/08/2017 03/08/17 | Price Changed | $289,900 | -0.4% | $166 / Sq Ft |
| 02/22/2017 02/22/17 | Price Changed | $291,000 | -0.3% | $167 / Sq Ft |
| 01/31/2017 01/31/17 | For Sale | $292,000 | +14.1% | $167 / Sq Ft |
| 01/30/2017 01/30/17 | Off Market | $256,000 | -- | -- |
| 01/13/2017 01/13/17 | Price Changed | $292,000 | -0.3% | $167 / Sq Ft |
| 11/19/2016 11/19/16 | Price Changed | $293,000 | -0.3% | $168 / Sq Ft |
| 10/28/2016 10/28/16 | Price Changed | $294,000 | -0.3% | $168 / Sq Ft |
| 10/05/2016 10/05/16 | For Sale | $295,000 | 0.0% | $169 / Sq Ft |
| 08/28/2015 08/28/15 | Rented | $1,775 | 0.0% | -- |
| 08/26/2015 08/26/15 | Under Contract | -- | -- | -- |
| 07/31/2015 07/31/15 | Off Market | $1,775 | -- | -- |
| 07/31/2015 07/31/15 | For Rent | $1,775 | +1.4% | -- |
| 01/01/2015 01/01/15 | Rented | $1,750 | 0.0% | -- |
| 12/29/2014 12/29/14 | Under Contract | -- | -- | -- |
| 12/03/2014 12/03/14 | For Rent | $1,750 | -- | -- |
Source: Arizona Regional Multiple Listing Service (ARMLS)
Tax History Compared to Growth
Tax History
| Year | Tax Paid | Tax Assessment Tax Assessment Total Assessment is a certain percentage of the fair market value that is determined by local assessors to be the total taxable value of land and additions on the property. | Land | Improvement |
|---|---|---|---|---|
| 2025 | $2,915 | $29,284 | -- | -- |
| 2024 | $2,854 | $23,796 | -- | -- |
| 2023 | $2,854 | $39,760 | $7,950 | $31,810 |
| 2022 | $2,392 | $33,830 | $6,760 | $27,070 |
| 2021 | $2,431 | $28,510 | $5,700 | $22,810 |
| 2020 | $2,348 | $28,230 | $5,640 | $22,590 |
| 2019 | $2,359 | $26,230 | $5,240 | $20,990 |
| 2018 | $2,273 | $24,960 | $4,990 | $19,970 |
| 2017 | $2,549 | $25,030 | $5,000 | $20,030 |
| 2016 | $2,136 | $23,320 | $4,660 | $18,660 |
| 2015 | $1,982 | $21,510 | $4,300 | $17,210 |
Source: Public Records
Agents Affiliated with this Home
-
Seller's Agent in 2022
Holly Waxman
Citiea
(602) 388-0319
23 in this area
160 Total Sales
-
Seller Co-Listing Agent in 2022
Benjamin Magnuson
eXp Realty
(602) 317-6256
2 in this area
90 Total Sales
-
Buyer's Agent in 2022
Christina Mooney
Realty Executives
(602) 538-5106
1 in this area
61 Total Sales
-
Seller's Agent in 2019
Jeff Fields
Russ Lyon Sotheby's International Realty
(480) 269-3123
1 in this area
78 Total Sales
-
Buyer's Agent in 2019
Brian Dunshie
Russ Lyon Sotheby's International Realty
(480) 522-6818
1 in this area
20 Total Sales
-
Seller's Agent in 2018
Mary-Lynn Allen
HomeSmart
(602) 463-5551
8 Total Sales
Map
Source: Arizona Regional Multiple Listing Service (ARMLS)
MLS Number: 5599809
APN: 159-26-216
Disclaimer: Certain information contained herein is derived from information provided by parties other than Homes.com. All information provided is deemed reliable, but is not guaranteed to be accurate and should be independently verified.
![]() All information should be verified by the recipient and none is guaranteed as accurate by ARMLS
All information should be verified by the recipient and none is guaranteed as accurate by ARMLS
Listing Information presented by local MLS brokerage: Ten-X, local REALTOR®- Arlene Richardson - (888)-952-6393
Nearby Homes
- 11052 N 10th Place
- 1075 E Shangri la Rd
- 922 E Desert Cove Ave
- 1023 E Sahuaro Dr
- 10655 N 9th St Unit 112
- 11238 N 11th St
- 1233 E Desert Cove Ave
- 1238 E Desert Cove Ave Unit 23
- 1236 E Mescal St
- 10606 N 11th St
- 1221 E Cholla St
- 10445 N 11th Place Unit 3
- 10445 N 11th Place Unit 1
- 921 E Becker Ln
- 10419 N 10th Place Unit 2
- 10409 N 10th St Unit 1
- 10420 N 10th St Unit 2
- 10408 N 11th St Unit 2
- 841 E Peoria Ave Unit 2
- 10410 N Cave Creek Rd Unit 2035