1039 N Edgewood St Arlington, VA 22201
Clarendon/Courthouse NeighborhoodEstimated Value: $1,606,000 - $3,411,000
6
Beds
9
Baths
7,700
Sq Ft
$364/Sq Ft
Est. Value
About This Home
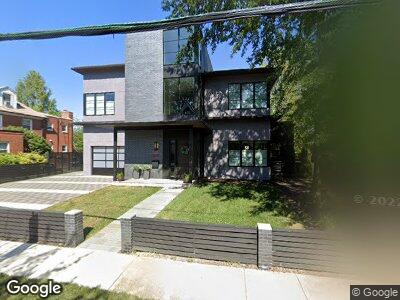
This home is located at 1039 N Edgewood St, Arlington, VA 22201 and is currently estimated at $2,806,355, approximately $364 per square foot. 1039 N Edgewood St is a home located in Arlington County with nearby schools including Innovation Elementary School, Dorothy Hamm Middle School, and Washington Liberty High School.
Ownership History
Date
Name
Owned For
Owner Type
Purchase Details
Closed on
Jul 27, 2021
Sold by
Scott M Johnson Revocable Trust
Bought by
Veronica Martino Revocable Trust
Current Estimated Value
Purchase Details
Closed on
Jun 3, 2016
Sold by
The Smolinski/Ray Living Trust Dated Jul
Bought by
Johnson Scott M and Martino Veronica
Home Financials for this Owner
Home Financials are based on the most recent Mortgage that was taken out on this home.
Original Mortgage
$922,350
Interest Rate
3.59%
Mortgage Type
New Conventional
Purchase Details
Closed on
Oct 17, 2003
Sold by
Hildt Jane
Bought by
Smolinski Steven
Home Financials for this Owner
Home Financials are based on the most recent Mortgage that was taken out on this home.
Original Mortgage
$650,000
Interest Rate
6.43%
Mortgage Type
New Conventional
Create a Home Valuation Report for This Property
The Home Valuation Report is an in-depth analysis detailing your home's value as well as a comparison with similar homes in the area
Home Values in the Area
Average Home Value in this Area
Purchase History
| Date | Buyer | Sale Price | Title Company |
|---|---|---|---|
| Veronica Martino Revocable Trust | -- | None Listed On Document | |
| Johnson Scott M | -- | None Available | |
| Johnson Scott M | $1,419,000 | Universal Title | |
| Smolinski Steven | $819,000 | -- |
Source: Public Records
Mortgage History
| Date | Status | Borrower | Loan Amount |
|---|---|---|---|
| Previous Owner | Johnson Scott M | $500,000 | |
| Previous Owner | Johnson Scott M | $922,350 | |
| Previous Owner | Smolinski Steven P | $769,700 | |
| Previous Owner | Smolinski Steven P | $793,860 | |
| Previous Owner | Smolinski Steven P | $810,500 | |
| Previous Owner | Smolinski Steven | $650,000 |
Source: Public Records
Tax History Compared to Growth
Tax History
| Year | Tax Paid | Tax Assessment Tax Assessment Total Assessment is a certain percentage of the fair market value that is determined by local assessors to be the total taxable value of land and additions on the property. | Land | Improvement |
|---|---|---|---|---|
| 2024 | $27,079 | $2,621,400 | $980,000 | $1,641,400 |
| 2023 | $26,500 | $2,572,800 | $960,000 | $1,612,800 |
| 2022 | $25,800 | $2,504,900 | $920,000 | $1,584,900 |
| 2021 | $23,937 | $2,324,000 | $896,000 | $1,428,000 |
| 2020 | $23,139 | $2,255,300 | $823,200 | $1,432,100 |
| 2019 | $22,936 | $2,235,500 | $784,000 | $1,451,500 |
| 2018 | $13,489 | $1,340,900 | $756,000 | $584,900 |
| 2017 | $13,316 | $1,323,700 | $728,000 | $595,700 |
| 2016 | $10,563 | $1,065,900 | $649,600 | $416,300 |
| 2015 | $10,337 | $1,037,900 | $621,600 | $416,300 |
| 2014 | $9,519 | $955,700 | $582,400 | $373,300 |
Source: Public Records
Map
Nearby Homes
- 1036 N Daniel St
- 1004 N Daniel St
- 1021 N Garfield St Unit B39
- 1021 N Garfield St Unit 831
- 1201 N Garfield St Unit 604
- 1201 N Garfield St Unit 106
- 1205 N Garfield St Unit 609
- 933 N Daniel St
- 1020 N Highland St Unit 1112
- 1020 N Highland St Unit 620
- 2534 Fairfax Dr Unit 5BII
- 1276 N Wayne St Unit 300
- 1276 N Wayne St Unit 408
- 1276 N Wayne St Unit 800
- 1276 N Wayne St Unit 320
- 1276 N Wayne St Unit 1007
- 1276 N Wayne St Unit 1030
- 1276 N Wayne St Unit 1219
- 911 N Irving St
- 2400 Clarendon Blvd Unit 1015
- 1039 N Edgewood St
- 1035 N Edgewood St
- 1047 N Edgewood St
- 1031 N Edgewood St
- 1040 N Daniel St
- 1044 N Daniel St
- 1036 N Daniel St Unit 2
- 1048 N Daniel St
- 1034 N Edgewood St
- 1027 N Edgewood St
- 1040 N Edgewood St
- 1044 N Edgewood St
- 1032 N Daniel St
- 1046 N Edgewood St
- 1028 N Daniel St
- 2819 11th St N
- 1023 N Edgewood St
- 1028 N Edgewood St
- 2817 11th St N
- 2815 11th St N