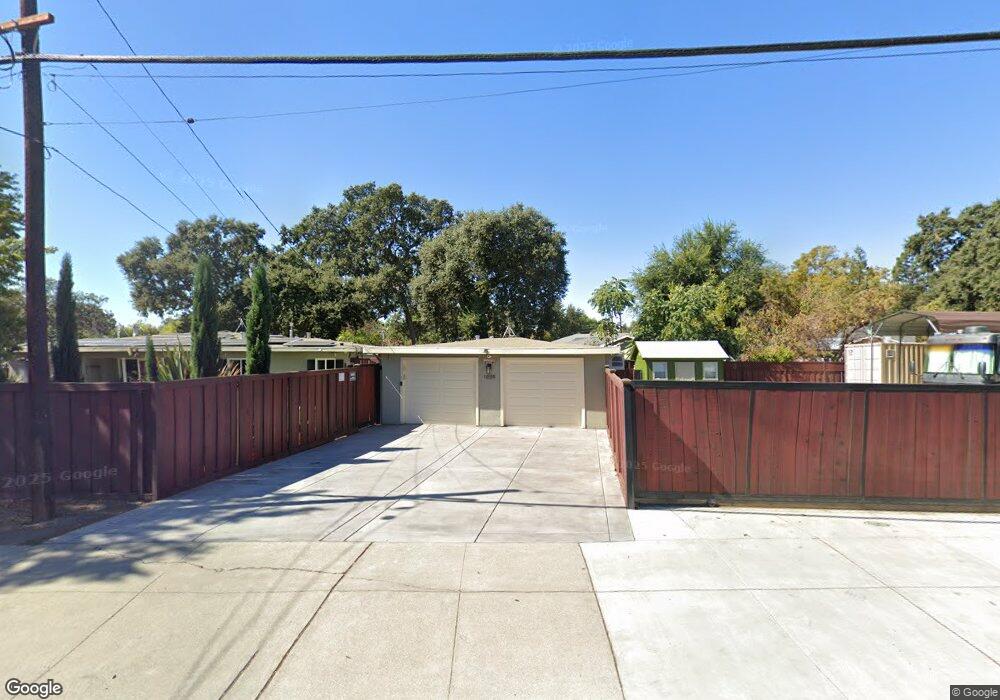
1039 Oak Grove Rd Concord, CA 94518
Tree Haven NeighborhoodEstimated Value: $799,000 - $1,023,000
3
Beds
2
Baths
1,324
Sq Ft
$675/Sq Ft
Est. Value
About This Home
This home is located at 1039 Oak Grove Rd, Concord, CA 94518 and is currently estimated at $893,601, approximately $674 per square foot. 1039 Oak Grove Rd is a home located in Contra Costa County with nearby schools including Ygnacio Valley Elementary School, Oak Grove Middle School, and Ygnacio Valley High School.
Ownership History
Date
Name
Owned For
Owner Type
Purchase Details
Closed on
Jun 19, 2014
Sold by
Edman Richard W and Edman Josefina Adorable
Bought by
Ledesma Jesse J
Current Estimated Value
Home Financials for this Owner
Home Financials are based on the most recent Mortgage that was taken out on this home.
Original Mortgage
$370,000
Outstanding Balance
$281,006
Interest Rate
4.16%
Mortgage Type
New Conventional
Estimated Equity
$612,595
Purchase Details
Closed on
Feb 6, 2013
Sold by
The Clemuel C Sands & Georgia L Sands Tr
Bought by
Edman Richard W and Adorable Edman Josefina
Purchase Details
Closed on
Mar 27, 1995
Sold by
Sands Clemuel C and Sands Georgia L
Bought by
Sands Clemuel C and Sands Georgia L
Create a Home Valuation Report for This Property
The Home Valuation Report is an in-depth analysis detailing your home's value as well as a comparison with similar homes in the area
Home Values in the Area
Average Home Value in this Area
Purchase History
| Date | Buyer | Sale Price | Title Company |
|---|---|---|---|
| Ledesma Jesse J | $500,000 | Fidelity National Title Co | |
| Edman Richard W | $240,000 | Fidelity National Title Co | |
| Edman Richard W | -- | Fidelity National Title Co | |
| Sands Clemuel C | -- | -- |
Source: Public Records
Mortgage History
| Date | Status | Borrower | Loan Amount |
|---|---|---|---|
| Open | Ledesma Jesse J | $370,000 |
Source: Public Records
Tax History Compared to Growth
Tax History
| Year | Tax Paid | Tax Assessment Tax Assessment Total Assessment is a certain percentage of the fair market value that is determined by local assessors to be the total taxable value of land and additions on the property. | Land | Improvement |
|---|---|---|---|---|
| 2025 | $7,510 | $612,920 | $367,754 | $245,166 |
| 2024 | $7,510 | $600,903 | $360,544 | $240,359 |
| 2023 | $7,367 | $589,122 | $353,475 | $235,647 |
| 2022 | $7,268 | $577,572 | $346,545 | $231,027 |
| 2021 | $7,088 | $566,248 | $339,750 | $226,498 |
| 2019 | $6,952 | $549,455 | $329,674 | $219,781 |
| 2018 | $14,221 | $538,682 | $323,210 | $215,472 |
| 2017 | $13,997 | $528,121 | $316,873 | $211,248 |
| 2016 | $13,887 | $517,766 | $310,660 | $207,106 |
| 2015 | $6,217 | $509,990 | $305,994 | $203,996 |
| 2014 | $3,198 | $241,089 | $190,862 | $50,227 |
Source: Public Records
Map
Nearby Homes
- 2005 Sierra Rd
- 1036 Oak Grove Rd Unit 86
- 1036 Oak Grove Rd Unit 21
- 1036 Oak Grove Rd Unit 105
- 2033 Sierra Rd Unit 10
- 2036 Sierra Rd Unit 2
- 1026 Fox Meadow Way
- 2045 Sierra Rd Unit 2
- 2055 Sierra Rd Unit 71
- 1971 Emerald St
- 1950 Emerald St
- 1005 Claremont Dr
- 2275 Whitman Rd
- 1750 Diane Ct
- 1781 Gilardy Dr
- 1133 Meadow Ln Unit 103
- 1133 Meadow Ln Unit 53
- 1660 Jenkinson Dr
- 1459 Del Rio Cir Unit C
- 946 Notre Dame Ave
- 1860 Pear Dr
- 1880 Pear Dr
- 1840 Pear Dr
- 1035 Oak Grove Rd
- 1041 Oak Grove Rd
- 2001 Sierra Rd Unit A
- 1033 Oak Grove Rd
- 1891 Pear Dr
- 1871 Pear Dr
- 1911 Pear Dr
- 1780 Pear Dr
- 1046 Willy Way
- 1851 Pear Dr
- 2003 Sierra Rd
- 2003 Sierra Rd Unit A
- 1931 Pear Dr
- 1971 Cameron Ct
- 1961 Cameron Ct
- 1044 Willy Way
- 1831 Pear Dr