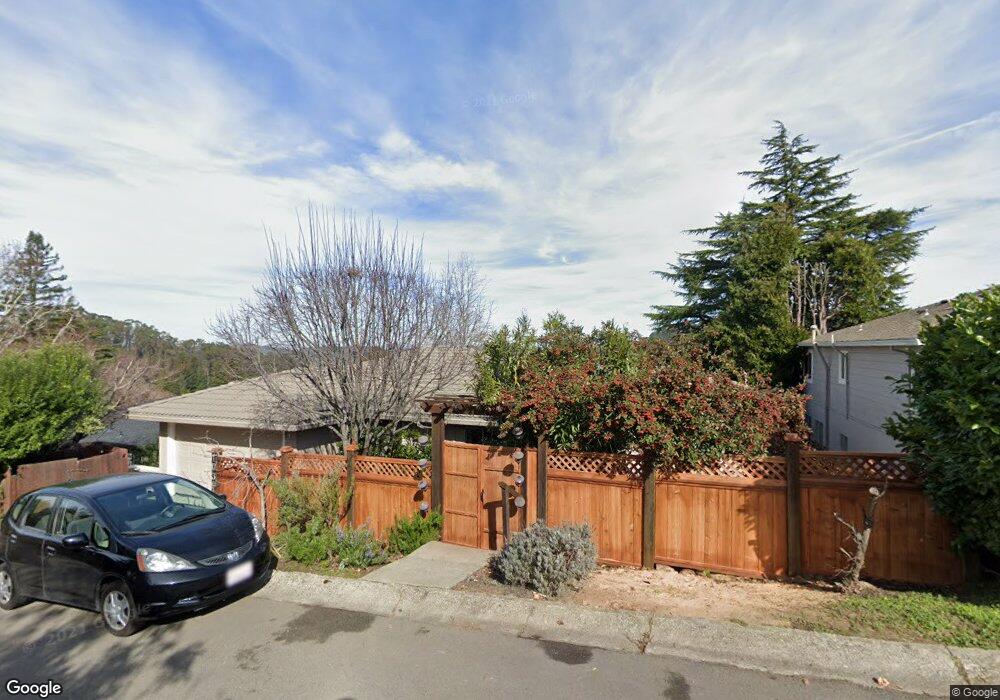
1039 Overlook Rd Berkeley, CA 94708
Berkeley Hills NeighborhoodEstimated Value: $1,482,000 - $1,755,002
4
Beds
3
Baths
1,999
Sq Ft
$819/Sq Ft
Est. Value
About This Home
This home is located at 1039 Overlook Rd, Berkeley, CA 94708 and is currently estimated at $1,637,751, approximately $819 per square foot. 1039 Overlook Rd is a home located in Alameda County with nearby schools including Cragmont Elementary School, Berkeley Arts Magnet at Whittier School, and Washington Elementary School.
Ownership History
Date
Name
Owned For
Owner Type
Purchase Details
Closed on
Jun 19, 2001
Sold by
Lagaay Robertus A
Bought by
Sherman Bradley K and Sanow Robin A
Current Estimated Value
Home Financials for this Owner
Home Financials are based on the most recent Mortgage that was taken out on this home.
Original Mortgage
$584,000
Outstanding Balance
$223,594
Interest Rate
7.21%
Estimated Equity
$1,414,157
Purchase Details
Closed on
Jan 22, 1997
Sold by
Lagaay Robertus A
Bought by
Lagaay Robertus A and Lagaay 1995 Trust
Purchase Details
Closed on
Feb 23, 1996
Sold by
Lagaay Robertus Alexander and Lagaay Marianne
Bought by
Lagaay Robertus Alexander and Lagaay Marianne
Purchase Details
Closed on
Jan 25, 1996
Sold by
Lagaay Robertus Alexander and Ijpma Lagaay Marianne
Bought by
Lagaay Robertus Alexander and Lagaay Marianne
Create a Home Valuation Report for This Property
The Home Valuation Report is an in-depth analysis detailing your home's value as well as a comparison with similar homes in the area
Home Values in the Area
Average Home Value in this Area
Purchase History
| Date | Buyer | Sale Price | Title Company |
|---|---|---|---|
| Sherman Bradley K | $730,000 | First American Title Guarant | |
| Lagaay Robertus A | -- | First American Title Guarant | |
| Lagaay Robertus A | -- | -- | |
| Lagaay Robertus Alexander | -- | -- | |
| Lagaay Robertus Alexander | -- | -- |
Source: Public Records
Mortgage History
| Date | Status | Borrower | Loan Amount |
|---|---|---|---|
| Open | Sherman Bradley K | $584,000 |
Source: Public Records
Tax History
| Year | Tax Paid | Tax Assessment Tax Assessment Total Assessment is a certain percentage of the fair market value that is determined by local assessors to be the total taxable value of land and additions on the property. | Land | Improvement |
|---|---|---|---|---|
| 2025 | $16,913 | $1,071,355 | $323,506 | $754,849 |
| 2024 | $16,913 | $1,050,214 | $317,164 | $740,050 |
| 2023 | $16,554 | $1,036,490 | $310,947 | $725,543 |
| 2022 | $16,241 | $1,009,167 | $304,850 | $711,317 |
| 2021 | $16,272 | $989,244 | $298,873 | $697,371 |
| 2020 | $15,356 | $986,032 | $295,809 | $690,223 |
| 2019 | $14,708 | $966,701 | $290,010 | $676,691 |
| 2018 | $14,290 | $947,751 | $284,325 | $663,426 |
| 2017 | $13,955 | $929,172 | $278,751 | $650,421 |
| 2016 | $13,483 | $910,958 | $273,287 | $637,671 |
| 2015 | $13,298 | $897,278 | $269,183 | $628,095 |
| 2014 | $13,145 | $879,707 | $263,912 | $615,795 |
Source: Public Records
Map
Nearby Homes
- 1119 Miller Ave
- 1123 Park Hills Rd
- 1110 Sterling Ave
- 982 Grizzly Peak Blvd
- 1165 Cragmont Ave
- 1024 Miller Ave
- 935 Grizzly Peak Blvd
- 1106 Cragmont Ave
- 1136 Keith Ave
- 0 Queens Rd Unit ML82024219
- 1375 Queens Rd
- 2501 Rose Walk
- 1468 Summit Rd
- 826 Indian Rock Ave
- 770 Santa Barbara Rd
- 614 Cragmont Ave
- 582 Euclid Ave
- 1471 Scenic Ave
- 2600 Hilgard Ave
- 479 Kentucky Ave
- 1035 Overlook Rd
- 1043 Overlook Rd
- 1042 Middlefield Rd
- 1038 Middlefield Rd
- 1046 Middlefield Rd
- 1047 Overlook Rd
- 1050 Overlook Rd
- 1044 Overlook Rd
- 1033 Overlook Rd
- 1052 Overlook Rd
- 1034 Middlefield Rd
- 1050 Middlefield Rd
- 1051 Overlook Rd
- 1040 Overlook Rd
- 1040 Overlook Rd
- 1056 Overlook Rd
- 1044 Park Hills Rd
- 1030 Middlefield Rd
- 1040 Park Hills Rd
- 1033 Middlefield Rd
Your Personal Tour Guide
Ask me questions while you tour the home.