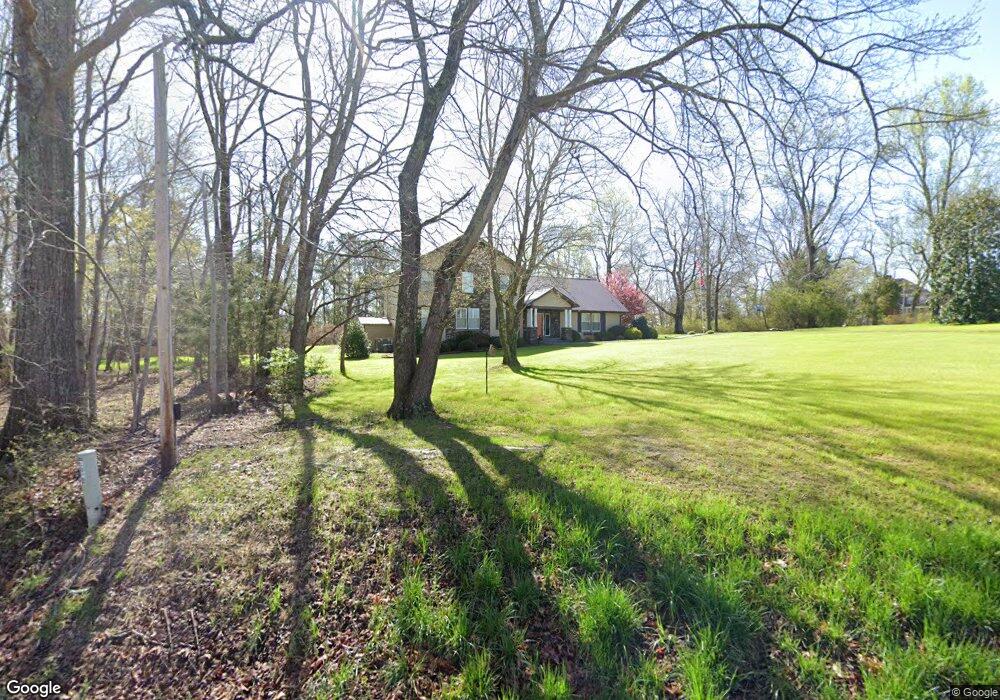
104 Annette Dr Dickson, TN 37055
Estimated Value: $658,000 - $726,000
--
Bed
4
Baths
3,808
Sq Ft
$184/Sq Ft
Est. Value
About This Home
This home is located at 104 Annette Dr, Dickson, TN 37055 and is currently estimated at $699,249, approximately $183 per square foot. 104 Annette Dr is a home located in Dickson County with nearby schools including Centennial Elementary School, Dickson Middle School, and Dickson County High School.
Ownership History
Date
Name
Owned For
Owner Type
Purchase Details
Closed on
Mar 29, 2017
Sold by
Beasley Jeffrey T
Bought by
Harmon Robert N and Harmon Tracy S
Current Estimated Value
Purchase Details
Closed on
Dec 18, 2013
Sold by
Beasley Jeffrey T
Bought by
Harmon Robert N and Harmon Tracy Shawn
Home Financials for this Owner
Home Financials are based on the most recent Mortgage that was taken out on this home.
Original Mortgage
$252,000
Interest Rate
4.25%
Mortgage Type
New Conventional
Purchase Details
Closed on
May 22, 1997
Bought by
Beaslley Jeffrey T and Beaslley Gloria
Purchase Details
Closed on
Aug 31, 1994
Sold by
Rundlett Rufus T
Bought by
Nienaber Kirk A
Purchase Details
Closed on
Sep 28, 1984
Bought by
Rundlett Rufus T and Rundlett Cona
Create a Home Valuation Report for This Property
The Home Valuation Report is an in-depth analysis detailing your home's value as well as a comparison with similar homes in the area
Home Values in the Area
Average Home Value in this Area
Purchase History
| Date | Buyer | Sale Price | Title Company |
|---|---|---|---|
| Harmon Robert N | $15,000 | -- | |
| Harmon Robert N | $252,000 | -- | |
| Beaslley Jeffrey T | $189,000 | -- | |
| Nienaber Kirk A | -- | -- | |
| Rundlett Rufus T | -- | -- |
Source: Public Records
Mortgage History
| Date | Status | Borrower | Loan Amount |
|---|---|---|---|
| Previous Owner | Harmon Robert N | $252,000 |
Source: Public Records
Tax History Compared to Growth
Tax History
| Year | Tax Paid | Tax Assessment Tax Assessment Total Assessment is a certain percentage of the fair market value that is determined by local assessors to be the total taxable value of land and additions on the property. | Land | Improvement |
|---|---|---|---|---|
| 2025 | -- | $142,600 | $0 | $0 |
| 2024 | $3,215 | $142,650 | $17,250 | $125,400 |
| 2023 | $3,215 | $102,950 | $11,400 | $91,550 |
| 2022 | $3,215 | $102,950 | $11,400 | $91,550 |
| 2021 | $3,215 | $102,950 | $11,400 | $91,550 |
| 2020 | $3,215 | $102,950 | $11,400 | $91,550 |
| 2019 | $3,215 | $102,950 | $11,400 | $91,550 |
| 2018 | $2,789 | $76,425 | $10,800 | $65,625 |
| 2017 | $2,789 | $76,425 | $10,800 | $65,625 |
| 2016 | $2,789 | $76,425 | $10,800 | $65,625 |
| 2015 | $2,575 | $66,375 | $10,800 | $55,575 |
| 2014 | $2,413 | $62,200 | $10,800 | $51,400 |
Source: Public Records
Map
Nearby Homes
- 444 Old Pond Ln
- 471 Old Pond Ln
- 445 Old Pond Ln
- 0 Old Pond Ln
- 435 Old Pond Ln
- 2 Old Pond Ln
- 4 Old Pond Ln
- 3 Old Pond Ln
- 404 Masters Way
- 0 Rouse Rd
- 500 Country Club Dr
- 122 Pond Rd
- 5 Dogwood Ct
- 201 Tanglewood Dr
- 2 Hickory Hill Dr
- 228 Druid Hills Dr
- 1233 N Charlotte St
- 0 W First St
- 909 W 1st St
- 205 Oak Dr
- 0 Annette Dr Unit 1802295
- 480 Old Pond Ln
- 105 Annette Dr
- 108 Annette Dr
- 102 Heather Ln
- 103 Annette Dr
- 454 Old Pond Ln
- 111 Annette Dr
- 100 Heather Ln
- 110 Annette Dr
- 500 Old Pond Ln
- 469 Old Pond Ln
- 475 Old Pond Ln
- 98 Heather Ln
- 102 Kimberly Dr
- 201 Annette Dr
- 477 Old Pond Ln
- 200 Kimberly Dr
- 627 Old Pond Ln
- 505 Old Pond Ln