104 Mays Landing Rd Stockbridge, GA 30281
Estimated Value: $233,000 - $242,009
3
Beds
2
Baths
1,422
Sq Ft
$167/Sq Ft
Est. Value
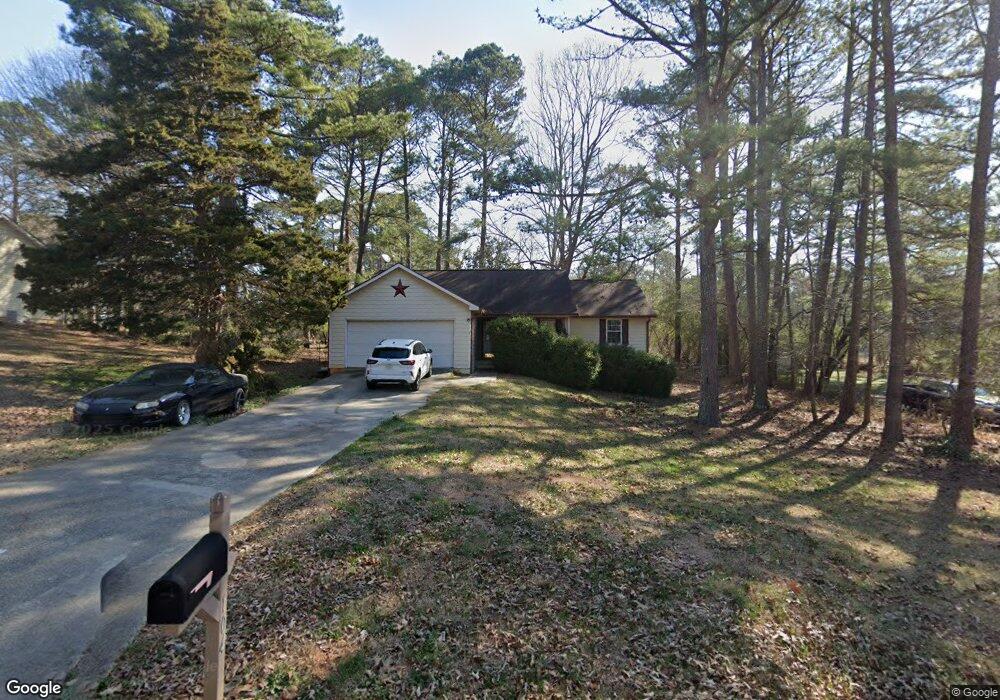
About This Home
This home is located at 104 Mays Landing Rd, Stockbridge, GA 30281 and is currently estimated at $237,502, approximately $167 per square foot. 104 Mays Landing Rd is a home located in Henry County with nearby schools including Cotton Indian Elementary School, Stockbridge Middle School, and Stockbridge High School.
Ownership History
Date
Name
Owned For
Owner Type
Purchase Details
Closed on
Oct 14, 2016
Sold by
Hall James L and Hall Teresa M
Bought by
Hall Jessica L
Current Estimated Value
Home Financials for this Owner
Home Financials are based on the most recent Mortgage that was taken out on this home.
Original Mortgage
$118,808
Outstanding Balance
$96,113
Interest Rate
3.75%
Mortgage Type
FHA
Estimated Equity
$141,389
Purchase Details
Closed on
Feb 29, 2008
Sold by
Williamson Susan V
Bought by
Hall James L and Hall Teresa M
Home Financials for this Owner
Home Financials are based on the most recent Mortgage that was taken out on this home.
Original Mortgage
$131,839
Interest Rate
5.68%
Purchase Details
Closed on
Jun 4, 2007
Sold by
Moynihan Claire
Bought by
Williamson Susan
Home Financials for this Owner
Home Financials are based on the most recent Mortgage that was taken out on this home.
Original Mortgage
$78,860
Interest Rate
6.1%
Create a Home Valuation Report for This Property
The Home Valuation Report is an in-depth analysis detailing your home's value as well as a comparison with similar homes in the area
Home Values in the Area
Average Home Value in this Area
Purchase History
| Date | Buyer | Sale Price | Title Company |
|---|---|---|---|
| Hall Jessica L | $121,000 | -- | |
| Hall James L | $132,900 | -- | |
| Williamson Susan | $96,000 | -- |
Source: Public Records
Mortgage History
| Date | Status | Borrower | Loan Amount |
|---|---|---|---|
| Open | Hall Jessica L | $118,808 | |
| Previous Owner | Hall James L | $131,839 | |
| Previous Owner | Williamson Susan | $78,860 |
Source: Public Records
Tax History Compared to Growth
Tax History
| Year | Tax Paid | Tax Assessment Tax Assessment Total Assessment is a certain percentage of the fair market value that is determined by local assessors to be the total taxable value of land and additions on the property. | Land | Improvement |
|---|---|---|---|---|
| 2024 | $2,326 | $90,040 | $14,000 | $76,040 |
| 2023 | $1,737 | $82,800 | $10,000 | $72,800 |
| 2022 | $1,768 | $62,760 | $10,000 | $52,760 |
| 2021 | $1,546 | $53,360 | $10,000 | $43,360 |
| 2020 | $1,433 | $48,600 | $8,000 | $40,600 |
| 2019 | $1,345 | $44,840 | $8,000 | $36,840 |
| 2018 | $1,215 | $39,360 | $8,000 | $31,360 |
| 2016 | $1,113 | $35,040 | $6,000 | $29,040 |
| 2015 | $672 | $23,280 | $4,000 | $19,280 |
| 2014 | $480 | $18,360 | $4,000 | $14,360 |
Source: Public Records
Map
Nearby Homes
- 20 King Place
- 270 Mays Rd
- 245 Amanda Ct
- 117 Valerie Ct
- 160 Springvalley Cir
- 905 E Atlanta Rd
- 135 Springvalley Way
- 110 Wildwood Rd Unit 2
- 169 Zircon Ln
- 174 Zircon Ln
- 200 Old Stagecoach Rd
- 146 Springvalley Cir
- 0 Stagecoach Rd Unit 20.17 ACRES 10455441
- 300 Shine Dr
- Dallas Plan at Diamante
- Austin Plan at Diamante
- 0 E Atlanta Rd Unit @KINSEY DR 10464743
- 0 E Atlanta Rd Unit @VALERIE CT 10464740
- 69 Belair Dr
- 952 E Atlanta Rd
- 108 Mays Landing Rd
- 0 Mays Ct Unit 7294808
- 0 Mays Ct
- 5 Walker Dr
- 5 Walker Dr Unit 1
- 112 Mays Landing Rd
- 105 Mays Landing Rd
- 103 Mays Landing Rd
- 15 Walker Dr
- 113 Mays Landing Rd
- 427 Mays Rd
- 116 Mays Landing Rd
- 15 Mays Ct
- 0 TRACT 2 Mays Rd
- TRACT 1 Mays Rd
- 453 Mays Rd
- 30 Mays Ct
- 10 Walker Dr
- 117 Mays Landing Rd
- 120 Mays Landing Rd