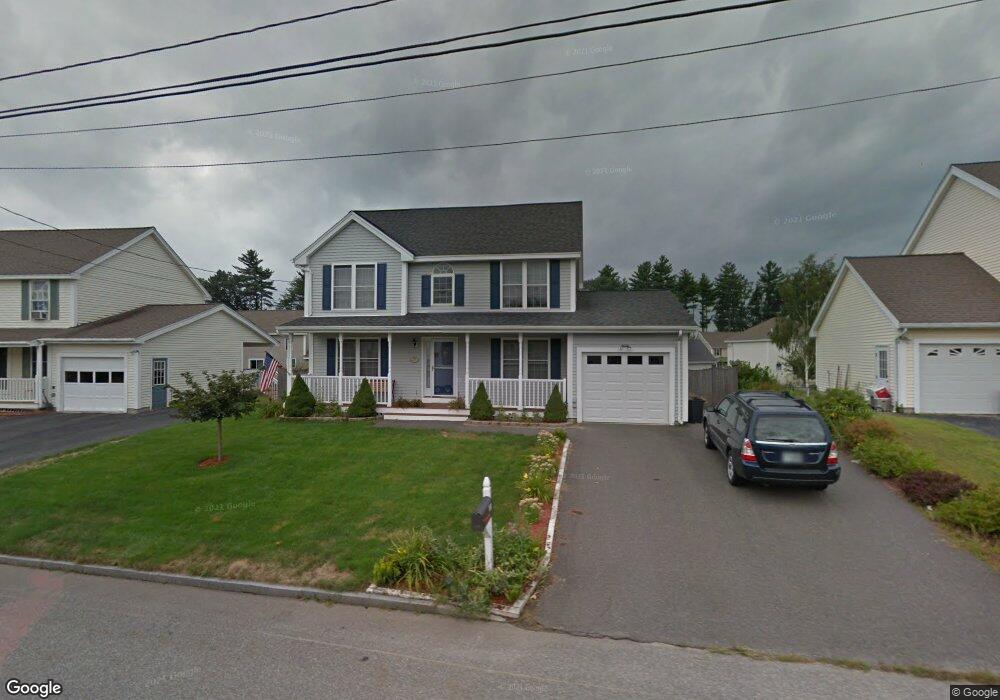
104 Wildwood St Manchester, NH 03103
Goffes Falls NeighborhoodEstimated Value: $525,000 - $588,054
3
Beds
2
Baths
2,588
Sq Ft
$214/Sq Ft
Est. Value
About This Home
This home is located at 104 Wildwood St, Manchester, NH 03103 and is currently estimated at $554,264, approximately $214 per square foot. 104 Wildwood St is a home located in Hillsborough County with nearby schools including Highland-Goffes Falls School, Southside Middle School, and Manchester Memorial High School.
Ownership History
Date
Name
Owned For
Owner Type
Purchase Details
Closed on
Jun 18, 2019
Sold by
Rosenberg Elizabeth A
Bought by
Rosenberg Jason M
Current Estimated Value
Home Financials for this Owner
Home Financials are based on the most recent Mortgage that was taken out on this home.
Original Mortgage
$225,000
Outstanding Balance
$197,419
Interest Rate
4.1%
Mortgage Type
New Conventional
Estimated Equity
$356,845
Purchase Details
Closed on
Jan 3, 2012
Sold by
Cartus Financial Corp
Bought by
Rosenberg Elizabeth A and Rosenberg Jason M
Purchase Details
Closed on
Aug 9, 2004
Sold by
Moreau Robert N and Moreau Kerri R
Bought by
Hamilton James and Hamilton Sarah
Purchase Details
Closed on
Dec 28, 1998
Sold by
Gagon Jean M
Bought by
Moreau Robert N and Moreau Kerri R
Create a Home Valuation Report for This Property
The Home Valuation Report is an in-depth analysis detailing your home's value as well as a comparison with similar homes in the area
Home Values in the Area
Average Home Value in this Area
Purchase History
| Date | Buyer | Sale Price | Title Company |
|---|---|---|---|
| Rosenberg Jason M | $25,000 | -- | |
| Rosenberg Jason M | $25,000 | -- | |
| Rosenberg Elizabeth A | $228,000 | -- | |
| Cartus Financial Corp | $228,000 | -- | |
| Cartus Financial Corp | $228,000 | -- | |
| Hamilton James | $289,900 | -- | |
| Hamilton James | $289,900 | -- | |
| Moreau Robert N | $154,000 | -- | |
| Moreau Robert N | $154,000 | -- |
Source: Public Records
Mortgage History
| Date | Status | Borrower | Loan Amount |
|---|---|---|---|
| Open | Rosenberg Jason M | $225,000 | |
| Closed | Rosenberg Jason M | $225,000 | |
| Previous Owner | Moreau Robert N | $218,000 | |
| Previous Owner | Moreau Robert N | $278,820 |
Source: Public Records
Tax History Compared to Growth
Tax History
| Year | Tax Paid | Tax Assessment Tax Assessment Total Assessment is a certain percentage of the fair market value that is determined by local assessors to be the total taxable value of land and additions on the property. | Land | Improvement |
|---|---|---|---|---|
| 2024 | $7,002 | $357,600 | $94,800 | $262,800 |
| 2023 | $6,744 | $357,600 | $94,800 | $262,800 |
| 2022 | $6,523 | $357,600 | $94,800 | $262,800 |
| 2021 | $6,322 | $357,600 | $94,800 | $262,800 |
| 2020 | $6,251 | $253,500 | $65,400 | $188,100 |
| 2019 | $6,165 | $253,500 | $65,400 | $188,100 |
| 2018 | $6,003 | $253,500 | $65,400 | $188,100 |
| 2017 | $5,912 | $253,500 | $65,400 | $188,100 |
| 2016 | $5,866 | $253,500 | $65,400 | $188,100 |
| 2015 | $5,708 | $243,500 | $62,100 | $181,400 |
| 2014 | $5,722 | $243,500 | $62,100 | $181,400 |
| 2013 | $5,520 | $243,500 | $62,100 | $181,400 |
Source: Public Records
Map
Nearby Homes
- 29 Watts Landing Unit 24
- 53 Pine Ave
- 15 Tamarack Ct
- 67 Pullman St
- 3-C Mustang Dr Unit MODEL
- 4543 Brown Ave
- 9 Mustang Dr Unit C
- 9 Mustang Dr Unit B
- 7 Mustang Dr Unit C
- 7 Mustang Dr Unit END UNIT-A
- 4481 Brown Ave
- 8 Iroquois Cir
- 769 Daniel Webster Hwy
- 4243 Brown Ave
- 22 Kimberly Dr
- 490 Charles Bancroft Hwy
- 15 Harvey Rd
- 25 Chatfield Dr
- 29 Bedford Rd
- 34 Chatham Dr
- 118 Wildwood St
- 90 Wildwood St
- 49 Sandy Brook St
- 61 Sandy Brook St
- 132 Wildwood St
- 37 Sandy Brook St
- 80 Wildwood St
- 91 Wildwood St
- 69 Sandy Brook St
- 75 Wildwood St
- 105 Wildwood St
- 144 Wildwood St
- 25 Sandy Brook St
- 68 Wildwood St
- 81 Sandy Brook St
- 59 Wildwood St
- 9 Sandy Brook St
- 769 Brent St
- 121 Wildwood St
- 781 Brent St