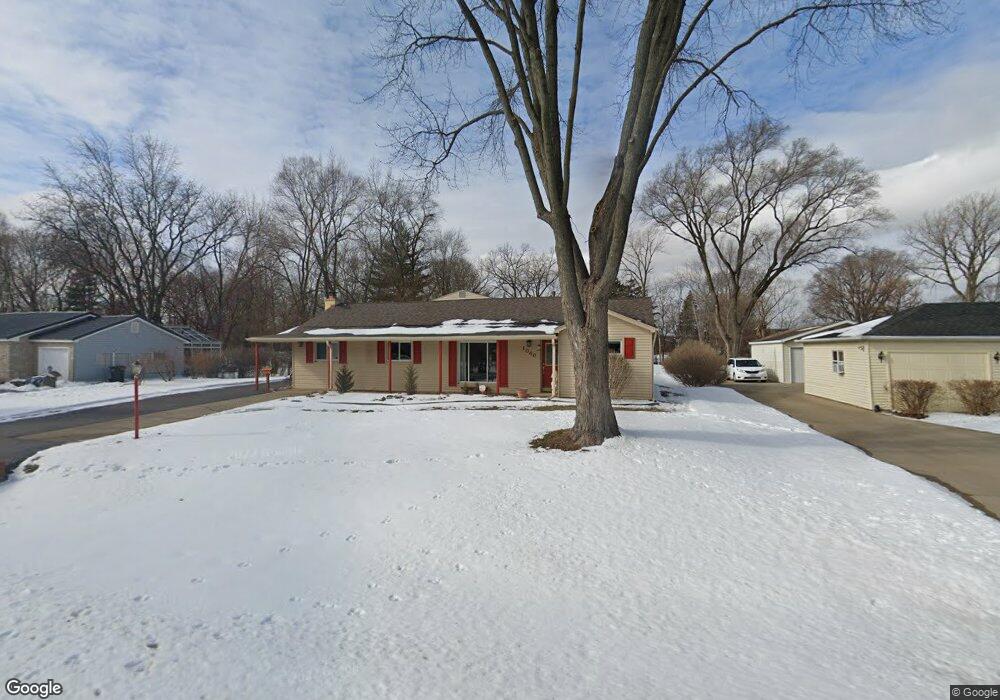
1040 Apricot St Hoffman Estates, IL 60169
Woodfield NeighborhoodEstimated Value: $422,000 - $528,000
4
Beds
3
Baths
2,422
Sq Ft
$196/Sq Ft
Est. Value
About This Home
This home is located at 1040 Apricot St, Hoffman Estates, IL 60169 and is currently estimated at $475,896, approximately $196 per square foot. 1040 Apricot St is a home located in Cook County with nearby schools including Fairview Elementary School, Helen Keller Junior High School, and J B Conant High School.
Ownership History
Date
Name
Owned For
Owner Type
Purchase Details
Closed on
Jun 27, 2014
Sold by
Wagner Lori Ann
Bought by
Kaufenberg Timothy
Current Estimated Value
Purchase Details
Closed on
Jan 31, 2007
Sold by
Wagner Lori Ann
Bought by
Lori Ann Wagner Trust
Purchase Details
Closed on
Apr 9, 2003
Sold by
Kaufenberg Timothy C
Bought by
Wagner Lori A
Home Financials for this Owner
Home Financials are based on the most recent Mortgage that was taken out on this home.
Original Mortgage
$179,000
Interest Rate
5.12%
Mortgage Type
Unknown
Purchase Details
Closed on
Aug 14, 2000
Sold by
Nastala Dale S and Nastala Lorri L
Bought by
Kaufenberg Timothy C
Home Financials for this Owner
Home Financials are based on the most recent Mortgage that was taken out on this home.
Original Mortgage
$213,750
Interest Rate
8.16%
Create a Home Valuation Report for This Property
The Home Valuation Report is an in-depth analysis detailing your home's value as well as a comparison with similar homes in the area
Home Values in the Area
Average Home Value in this Area
Purchase History
| Date | Buyer | Sale Price | Title Company |
|---|---|---|---|
| Kaufenberg Timothy | $233,000 | First American Title | |
| Lori Ann Wagner Trust | -- | None Available | |
| Wagner Lori A | $239,000 | Lawyers Title Insurance Corp | |
| Wagner Lori A | $239,000 | Lawyers Title Insurance Corp | |
| Kaufenberg Timothy C | $225,000 | -- |
Source: Public Records
Mortgage History
| Date | Status | Borrower | Loan Amount |
|---|---|---|---|
| Previous Owner | Wagner Lori A | $179,000 | |
| Previous Owner | Kaufenberg Timothy C | $213,750 |
Source: Public Records
Tax History
| Year | Tax Paid | Tax Assessment Tax Assessment Total Assessment is a certain percentage of the fair market value that is determined by local assessors to be the total taxable value of land and additions on the property. | Land | Improvement |
|---|---|---|---|---|
| 2025 | $8,602 | $46,000 | $18,352 | $27,648 |
| 2024 | $8,602 | $34,000 | $10,487 | $23,513 |
| 2023 | $8,269 | $34,000 | $10,487 | $23,513 |
| 2022 | $8,269 | $34,000 | $10,487 | $23,513 |
| 2021 | $7,116 | $28,474 | $11,142 | $17,332 |
| 2020 | $6,474 | $28,474 | $11,142 | $17,332 |
| 2019 | $6,403 | $31,994 | $11,142 | $20,852 |
| 2018 | $8,040 | $28,093 | $9,831 | $18,262 |
| 2017 | $7,916 | $28,093 | $9,831 | $18,262 |
| 2016 | $7,940 | $29,147 | $9,831 | $19,316 |
| 2015 | $6,648 | $23,322 | $8,520 | $14,802 |
| 2014 | $6,548 | $23,322 | $8,520 | $14,802 |
| 2013 | $6,362 | $23,322 | $8,520 | $14,802 |
Source: Public Records
Map
Nearby Homes
- 1120 N Bluebonnet Ln
- 75 Carthage Ln
- 616 Manomet Ct
- 100 Des Plaines Ln
- 848 Newbury Ct
- 368 Willow Tree Ct
- 812 Dracut Ln Unit D
- 745 Whalom Ln Unit 3A1
- 796 Stonewall Ct
- 100 White Oak Ct Unit 1
- 860 Olive St
- 555 Heritage Dr Unit 315
- 200 W Thacker St
- 625 Morton St
- 600 Mesa Dr Unit 104
- 600 Mesa Dr Unit 103
- 480 Illinois Blvd
- 1570 Jefferson Rd
- 1750 Sleepy Hollow Ct Unit 3
- 313 Lincoln St
- 1060 Apricot St
- 1020 Apricot St
- 1070 Apricot St
- 1000 Apricot St
- 1045 Apricot St
- 1080 Apricot St
- 980 Apricot St
- 1005 Apricot St
- 1045 Apple St
- 1065 Apricot St
- 1025 Apple St
- 1065 Apple St
- 1075 Apricot St
- 1015 Apple St
- 985 Apricot St
- 220 Carnation Ln
- 1085 Apple St
- 995 Apple St
- 1100 Apricot St
- 160 Hawthorn Ln
Your Personal Tour Guide
Ask me questions while you tour the home.