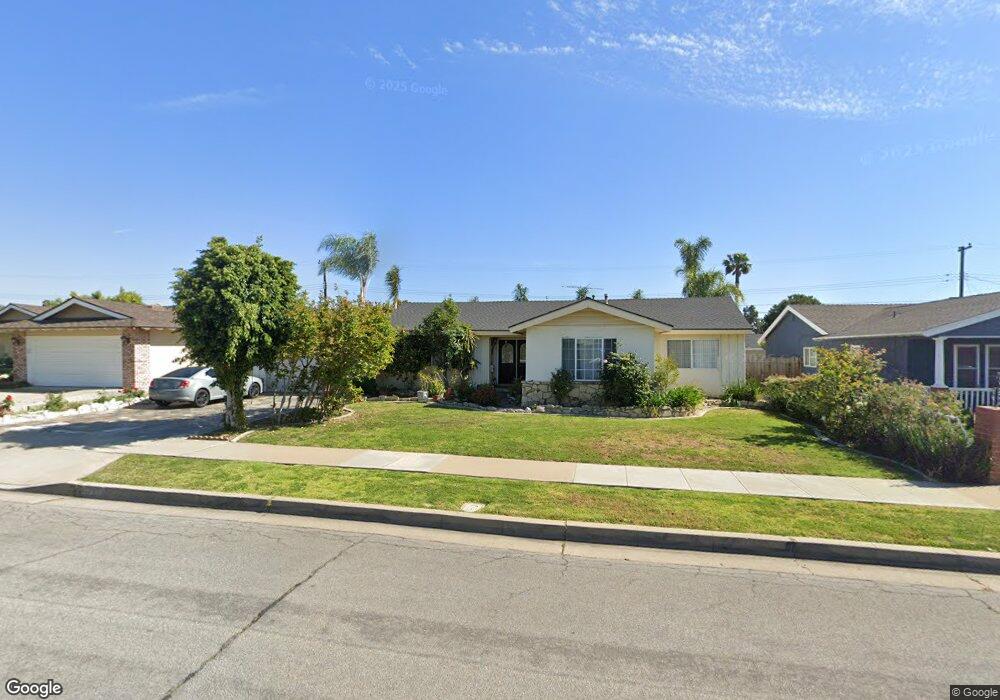
1040 E Grove Ave Orange, CA 92865
Estimated Value: $1,051,000 - $1,221,000
3
Beds
2
Baths
1,979
Sq Ft
$568/Sq Ft
Est. Value
About This Home
This home is located at 1040 E Grove Ave, Orange, CA 92865 and is currently estimated at $1,125,060, approximately $568 per square foot. 1040 E Grove Ave is a home located in Orange County with nearby schools including Taft Elementary School, Cerro Villa Middle School, and Villa Park High School.
Ownership History
Date
Name
Owned For
Owner Type
Purchase Details
Closed on
Dec 3, 2020
Sold by
Gholamiss James Dean
Bought by
Santa Fe Mageztkd Financial
Current Estimated Value
Purchase Details
Closed on
Jul 17, 2009
Sold by
Sampastani Andy
Bought by
Gholamiss James Dean
Purchase Details
Closed on
Aug 1, 2005
Sold by
Yu Tzu Ting and Kwan Chin Dah
Bought by
Sampastani Andy
Purchase Details
Closed on
Jul 20, 2005
Sold by
Yu Tzu Ting
Bought by
Kwan Chin Dah and Yu Tzu Ting
Purchase Details
Closed on
Dec 11, 2003
Sold by
Kwan Chin Dah
Bought by
Yu Tzu Ting
Purchase Details
Closed on
Jun 30, 1997
Sold by
Moncrief Bill T and Moncrief Valerie J
Bought by
Kwan Chin Dah and Yu Tzu Ting
Home Financials for this Owner
Home Financials are based on the most recent Mortgage that was taken out on this home.
Original Mortgage
$100,000
Interest Rate
7.62%
Create a Home Valuation Report for This Property
The Home Valuation Report is an in-depth analysis detailing your home's value as well as a comparison with similar homes in the area
Home Values in the Area
Average Home Value in this Area
Purchase History
| Date | Buyer | Sale Price | Title Company |
|---|---|---|---|
| Santa Fe Mageztkd Financial | -- | None Available | |
| Gholamiss James Dean | $1,000 | None Available | |
| Sampastani Andy | $610,000 | United Title Company-La | |
| Kwan Chin Dah | -- | -- | |
| Yu Tzu Ting | -- | -- | |
| Kwan Chin Dah | $200,000 | Benefit Land Title Company |
Source: Public Records
Mortgage History
| Date | Status | Borrower | Loan Amount |
|---|---|---|---|
| Previous Owner | Kwan Chin Dah | $100,000 |
Source: Public Records
Tax History
| Year | Tax Paid | Tax Assessment Tax Assessment Total Assessment is a certain percentage of the fair market value that is determined by local assessors to be the total taxable value of land and additions on the property. | Land | Improvement |
|---|---|---|---|---|
| 2025 | $8,695 | $800,998 | $674,763 | $126,235 |
| 2024 | $8,695 | $785,293 | $661,533 | $123,760 |
| 2023 | $8,505 | $769,896 | $648,562 | $121,334 |
| 2022 | $8,341 | $754,800 | $635,845 | $118,955 |
| 2021 | $8,107 | $740,000 | $623,377 | $116,623 |
| 2020 | $5,245 | $473,293 | $342,418 | $130,875 |
| 2019 | $5,178 | $464,013 | $335,704 | $128,309 |
| 2018 | $5,098 | $454,915 | $329,121 | $125,794 |
| 2017 | $4,887 | $445,996 | $322,668 | $123,328 |
| 2016 | $4,792 | $437,251 | $316,341 | $120,910 |
| 2015 | $4,721 | $430,684 | $311,590 | $119,094 |
| 2014 | $4,620 | $422,248 | $305,486 | $116,762 |
Source: Public Records
Map
Nearby Homes
- 1021 E Del Mar Ave
- 910 E Glendale Ave
- 928 E Meats Ave
- 1760 N Silverwood St
- 1830 N Ridgewood St
- 1011 E Chestnut Ave
- 2049 N Orange Olive Rd
- 1758 N Widdows Way
- 1908 E Coral Ave
- 1036 E Trenton Ave
- 3176 N Tustin St
- 2051 N Highland St
- 1931 E Meats Ave Unit 148
- 2295 N Tustin St Unit 31
- 1540 E Trenton Ave Unit 79
- 1540 E Trenton Ave Unit 126
- 1540 E Trenton Ave Unit 95
- 2433 N Cameo Ct
- 2225 E Grove Ave
- 1800 E Heim Ave Unit 48
- 1104 E Grove Ave
- 1028 E Grove Ave
- 1047 E Buckeyewood Ave
- 1033 E Buckeyewood Ave
- 1105 E Buckeyewood Ave
- 1116 E Grove Ave
- 1016 E Grove Ave
- 1041 E Grove Ave
- 1019 E Buckeyewood Ave
- 1105 E Grove Ave
- 1029 E Grove Ave
- 1119 E Buckeyewood Ave
- 1017 E Grove Ave
- 1117 E Grove Ave
- 1128 E Grove Ave
- 1004 E Grove Ave
- 1005 E Buckeyewood Ave
- 1920 N Maplewood St
- 1028 E Del Mar Ave
- 1104 E Del Mar Ave
Your Personal Tour Guide
Ask me questions while you tour the home.