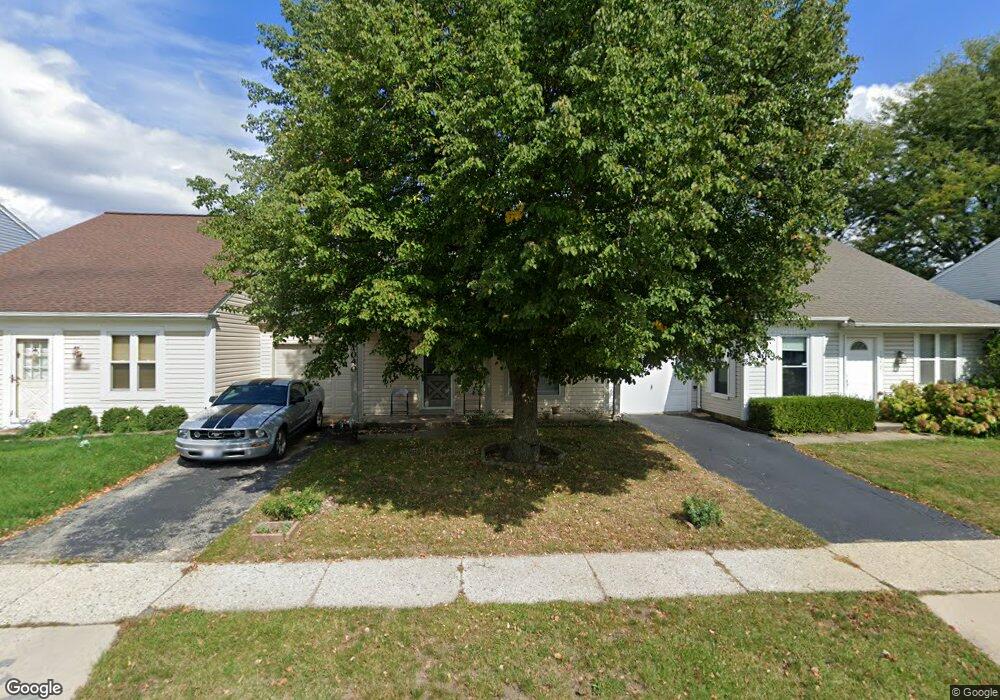
1040 Perry Dr Algonquin, IL 60102
Estimated Value: $246,000 - $269,000
3
Beds
2
Baths
1,248
Sq Ft
$209/Sq Ft
Est. Value
About This Home
This home is located at 1040 Perry Dr, Algonquin, IL 60102 and is currently estimated at $260,291, approximately $208 per square foot. 1040 Perry Dr is a home located in McHenry County with nearby schools including Algonquin Lakes Elementary School, Algonquin Middle School, and Dundee-Crown High School.
Ownership History
Date
Name
Owned For
Owner Type
Purchase Details
Closed on
Jun 27, 2003
Sold by
Loch John M and Loch Lynn E
Bought by
Romero Jorge
Current Estimated Value
Home Financials for this Owner
Home Financials are based on the most recent Mortgage that was taken out on this home.
Original Mortgage
$117,200
Interest Rate
6.4%
Mortgage Type
Unknown
Purchase Details
Closed on
Apr 29, 1999
Sold by
Barker Bobby E and Barker Captola B
Bought by
Loch John M and Loch Lynn E
Home Financials for this Owner
Home Financials are based on the most recent Mortgage that was taken out on this home.
Original Mortgage
$107,720
Interest Rate
7.04%
Mortgage Type
FHA
Purchase Details
Closed on
Apr 25, 1996
Sold by
Maraccini Michael and Fitch Sheryl L
Bought by
Barker Bobby E and Barker Captola B
Home Financials for this Owner
Home Financials are based on the most recent Mortgage that was taken out on this home.
Original Mortgage
$78,000
Interest Rate
7.91%
Create a Home Valuation Report for This Property
The Home Valuation Report is an in-depth analysis detailing your home's value as well as a comparison with similar homes in the area
Home Values in the Area
Average Home Value in this Area
Purchase History
| Date | Buyer | Sale Price | Title Company |
|---|---|---|---|
| Romero Jorge | $146,500 | Nlt Title Llc | |
| Loch John M | $108,000 | Chicago Title | |
| Barker Bobby E | $104,000 | Chicago Title Insurance Co |
Source: Public Records
Mortgage History
| Date | Status | Borrower | Loan Amount |
|---|---|---|---|
| Previous Owner | Romero Jorge | $117,200 | |
| Previous Owner | Loch John M | $107,720 | |
| Previous Owner | Barker Bobby E | $78,000 |
Source: Public Records
Tax History Compared to Growth
Tax History
| Year | Tax Paid | Tax Assessment Tax Assessment Total Assessment is a certain percentage of the fair market value that is determined by local assessors to be the total taxable value of land and additions on the property. | Land | Improvement |
|---|---|---|---|---|
| 2024 | $4,082 | $60,177 | $10,257 | $49,920 |
| 2023 | $3,836 | $53,821 | $9,174 | $44,647 |
| 2022 | $3,870 | $51,130 | $8,282 | $42,848 |
| 2021 | $3,694 | $47,634 | $7,716 | $39,918 |
| 2020 | $3,587 | $45,948 | $7,443 | $38,505 |
| 2019 | $3,487 | $43,978 | $7,124 | $36,854 |
| 2018 | $2,533 | $32,572 | $6,581 | $25,991 |
| 2017 | $2,458 | $30,685 | $6,200 | $24,485 |
| 2016 | $2,396 | $28,780 | $5,815 | $22,965 |
| 2013 | -- | $31,080 | $5,425 | $25,655 |
Source: Public Records
Map
Nearby Homes
- 1561 Cumberland Pkwy
- 1659 E Algonquin Rd
- 920 Plymouth Ct
- 911 Old Oak Cir Unit 1
- 903 Old Oak Cir
- 1188 E Algonquin Rd
- Lot 4 b Ryan Pkwy
- 1770 E Algonquin Rd
- 14 Oxford Ct
- 2 Sunset Ln
- 620 Old Oak Cir
- 605 Claymont Ct
- 600 E Algonquin Rd
- 69 Alice St
- 925 N River Rd
- 1782 Cumberland Pkwy
- 2 Cumberland Pkwy
- 2008 Clematis Dr
- 1943 Ozark Pkwy
- 9999 Sandbloom Rd
- 1030 Perry Dr
- 1050 Perry Dr
- 1020 Perry Dr
- 1060 Perry Dr
- 1010 Perry Dr
- 1021 Timberwood Ln Unit 1
- 1070 Perry Dr
- 1011 Timberwood Ln
- 1031 Timberwood Ln
- 1021 Perry Dr
- 1031 Perry Dr
- 1031 Perry Dr Unit 1031
- 1011 Perry Dr
- 1041 Perry Dr
- 1100 Perry Dr
- 1000 Perry Dr
- 1001 Perry Dr
- 1001 Timberwood Ln
- 1041 Timberwood Ln
- 1051 Perry Dr