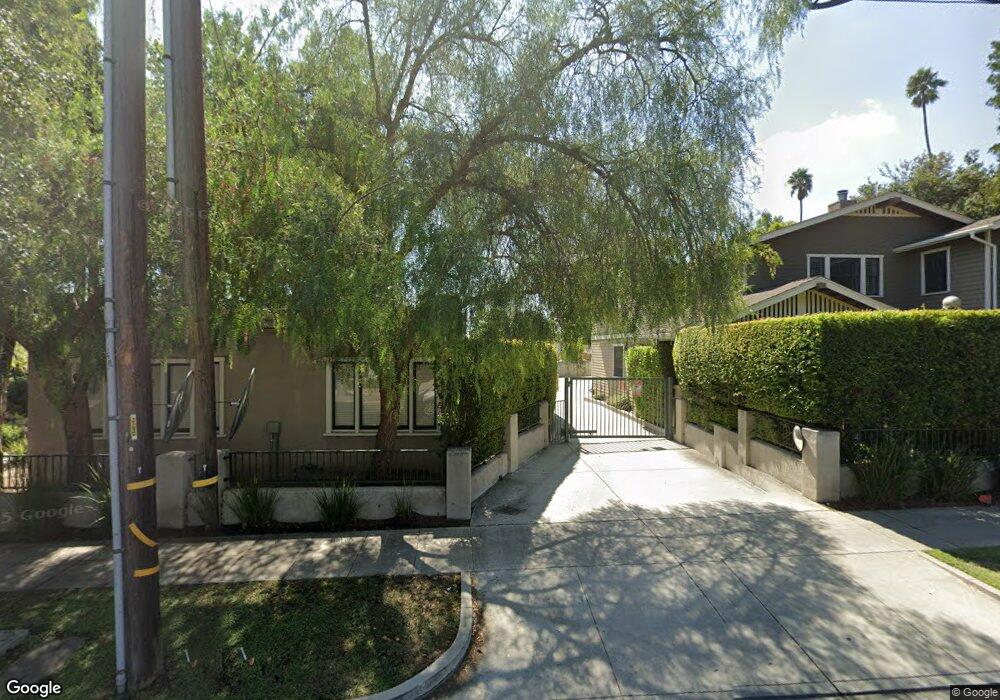
1040 S Orng Grv Blvd Unit 14 Pasadena, CA 91105
Lower Arroyo NeighborhoodEstimated Value: $905,386 - $1,283,000
2
Beds
2
Baths
1,456
Sq Ft
$712/Sq Ft
Est. Value
About This Home
This home is located at 1040 S Orng Grv Blvd Unit 14, Pasadena, CA 91105 and is currently estimated at $1,036,847, approximately $712 per square foot. 1040 S Orng Grv Blvd Unit 14 is a home located in Los Angeles County with nearby schools including McKinley School, Blair High School, and Westridge School.
Ownership History
Date
Name
Owned For
Owner Type
Purchase Details
Closed on
Jul 21, 2010
Sold by
Bergener Margret B
Bought by
Bergener Margret B and The Margret B Bergener 2010 Trust
Current Estimated Value
Purchase Details
Closed on
Aug 8, 2003
Sold by
Bergener Margaret B and The Margaret B Bergener Living
Bought by
Bergener Margaret B
Home Financials for this Owner
Home Financials are based on the most recent Mortgage that was taken out on this home.
Original Mortgage
$200,000
Interest Rate
5.46%
Mortgage Type
Purchase Money Mortgage
Purchase Details
Closed on
Oct 17, 1997
Sold by
Bergener John E and Bergener Margret B
Bought by
Bergener Margaret B and Margret B Bergener Living Trust
Purchase Details
Closed on
Apr 26, 1994
Sold by
Bergener John E and Bergener Douglas Wikle
Bought by
Bergener John E
Create a Home Valuation Report for This Property
The Home Valuation Report is an in-depth analysis detailing your home's value as well as a comparison with similar homes in the area
Home Values in the Area
Average Home Value in this Area
Purchase History
| Date | Buyer | Sale Price | Title Company |
|---|---|---|---|
| Bergener Margret B | -- | None Available | |
| Bergener Margaret B | -- | Landsafe Title Of Ca Inc | |
| Bergener Margaret B | -- | Investors Title Company | |
| Bergener John E | -- | -- |
Source: Public Records
Mortgage History
| Date | Status | Borrower | Loan Amount |
|---|---|---|---|
| Closed | Bergener Margaret B | $200,000 |
Source: Public Records
Tax History Compared to Growth
Tax History
| Year | Tax Paid | Tax Assessment Tax Assessment Total Assessment is a certain percentage of the fair market value that is determined by local assessors to be the total taxable value of land and additions on the property. | Land | Improvement |
|---|---|---|---|---|
| 2025 | $1,433 | $98,743 | $53,330 | $45,413 |
| 2024 | $1,433 | $96,808 | $52,285 | $44,523 |
| 2023 | $1,417 | $94,910 | $51,260 | $43,650 |
| 2022 | $1,374 | $93,050 | $50,255 | $42,795 |
| 2021 | $1,317 | $91,226 | $49,270 | $41,956 |
| 2019 | $1,275 | $88,521 | $47,809 | $40,712 |
| 2018 | $1,221 | $86,786 | $46,872 | $39,914 |
| 2016 | $1,152 | $83,417 | $45,052 | $38,365 |
| 2015 | $1,137 | $82,165 | $44,376 | $37,789 |
| 2014 | $1,126 | $80,556 | $43,507 | $37,049 |
Source: Public Records
Map
Nearby Homes
- 1068 S Orange Grove Blvd
- 1105 S Orange Grove Blvd
- 215 Madeline Dr
- 1010 Stoneridge Dr
- 218 Madeline Dr
- 237 W State St
- 1200 S Orange Grove Blvd Unit 15
- 225 W State St
- 505 Orange Grove Cir
- 1112 S Pasadena Ave
- 180 W State St
- 888 S Pasadena Ave
- 1245 S Orange Grove Blvd Unit 5
- 835 S Orange Grove Blvd
- 117 Brocadero Place
- 1200 S Pasadena Ave
- 201 Orange Grove Ave
- 783 S Orange Grove Blvd Unit 2
- 600 Columbia St
- 767 S Orange Grove Blvd Unit 3
- 1040 S Orange Grove Blvd Unit 16
- 1040 S Orng Grv Blvd Unit 21
- 1040 S Orng Grv Blvd Unit 1
- 1040 S Orng Grv Blvd Unit 12
- 1040 S Orng Grv Blvd Unit 11
- 1040 S Orng Grv Blvd Unit 10
- 1040 S Orng Grv Blvd Unit 9
- 1040 S Orng Grv Blvd Unit 8
- 1040 S Orng Grv Blvd Unit 7
- 1040 S Orng Grv Blvd Unit 6
- 1040 S Orng Grv Blvd Unit 5
- 1040 S Orng Grv Blvd Unit 4
- 1040 S Orng Grv Blvd Unit 3
- 1040 S Orng Grv Blvd Unit 2
- 1040 S Orng Grv Blvd Unit 20
- 1040 S Orng Grv Blvd Unit 19
- 1040 S Orng Grv Blvd Unit 18
- 1040 S Orng Grv Blvd Unit 17
- 1040 S Orng Grv Blvd Unit 16
- 1040 S Orng Grv Blvd Unit 15