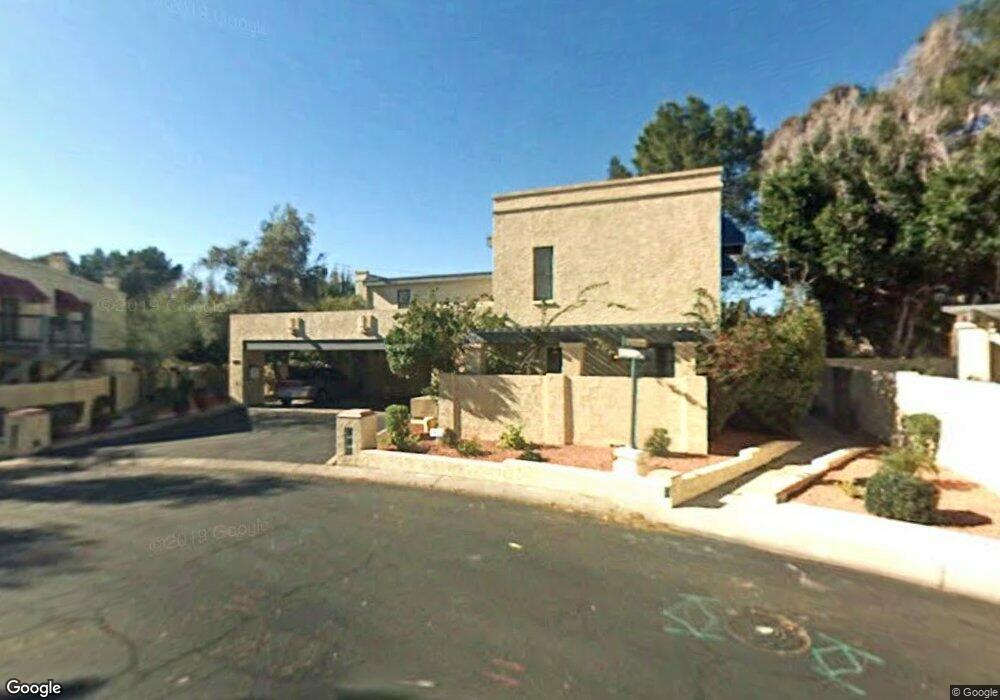
10402 N 11th St Unit 3 Phoenix, AZ 85020
North Mountain Village NeighborhoodEstimated Value: $288,000 - $316,089
--
Bed
1
Bath
1,060
Sq Ft
$283/Sq Ft
Est. Value
About This Home
This home is located at 10402 N 11th St Unit 3, Phoenix, AZ 85020 and is currently estimated at $300,022, approximately $283 per square foot. 10402 N 11th St Unit 3 is a home located in Maricopa County with nearby schools including Sunnyslope Elementary School, Sunnyslope High School, and Montessori Day Public Schools Chartered - Mountainside.
Ownership History
Date
Name
Owned For
Owner Type
Purchase Details
Closed on
Aug 13, 2013
Sold by
Collier Tracie L
Bought by
Pinckert Eric Andrew and Collier Tracie Lynn
Current Estimated Value
Purchase Details
Closed on
Feb 20, 1997
Sold by
Saenz Nora
Bought by
Collier Tracie L
Home Financials for this Owner
Home Financials are based on the most recent Mortgage that was taken out on this home.
Original Mortgage
$40,000
Interest Rate
7.58%
Mortgage Type
New Conventional
Purchase Details
Closed on
Nov 13, 1995
Sold by
Poland Edward H and Poland Reeva C
Bought by
Saenz Nora
Home Financials for this Owner
Home Financials are based on the most recent Mortgage that was taken out on this home.
Original Mortgage
$63,050
Interest Rate
7.51%
Mortgage Type
New Conventional
Create a Home Valuation Report for This Property
The Home Valuation Report is an in-depth analysis detailing your home's value as well as a comparison with similar homes in the area
Home Values in the Area
Average Home Value in this Area
Purchase History
| Date | Buyer | Sale Price | Title Company |
|---|---|---|---|
| Pinckert Eric Andrew | -- | None Available | |
| Collier Tracie L | $70,000 | Nations Title Insurance | |
| Saenz Nora | $66,400 | First American Title |
Source: Public Records
Mortgage History
| Date | Status | Borrower | Loan Amount |
|---|---|---|---|
| Previous Owner | Collier Tracie L | $40,000 | |
| Previous Owner | Saenz Nora | $63,050 |
Source: Public Records
Tax History Compared to Growth
Tax History
| Year | Tax Paid | Tax Assessment Tax Assessment Total Assessment is a certain percentage of the fair market value that is determined by local assessors to be the total taxable value of land and additions on the property. | Land | Improvement |
|---|---|---|---|---|
| 2025 | $1,017 | $9,125 | -- | -- |
| 2024 | $959 | $8,690 | -- | -- |
| 2023 | $959 | $22,150 | $4,430 | $17,720 |
| 2022 | $925 | $16,320 | $3,260 | $13,060 |
| 2021 | $948 | $15,820 | $3,160 | $12,660 |
| 2020 | $923 | $14,220 | $2,840 | $11,380 |
| 2019 | $906 | $12,720 | $2,540 | $10,180 |
| 2018 | $880 | $11,280 | $2,250 | $9,030 |
| 2017 | $878 | $9,480 | $1,890 | $7,590 |
| 2016 | $862 | $8,350 | $1,670 | $6,680 |
| 2015 | $800 | $7,550 | $1,510 | $6,040 |
Source: Public Records
Map
Nearby Homes
- 1101 E North Ln Unit 3
- 10408 N 11th St Unit 2
- 10420 N 11th St Unit 3
- 1172 E Cochise Dr
- 1173 E Cochise Dr
- 10256 N 12th Place Unit 2
- 10240 N 12th Place Unit 2
- 10409 N 10th St Unit 1
- 10445 N 11th Place Unit 3
- 10414 N 10th St Unit 1
- 10420 N 10th St Unit 2
- 10247 N 12th Place Unit 2
- 10224 N 12th Place Unit 2
- 10606 N 11th St
- 10410 N Cave Creek Rd Unit 2119
- 10410 N Cave Creek Rd Unit 1230
- 10410 N Cave Creek Rd Unit 1032
- 10410 N Cave Creek Rd Unit 2114
- 10410 N Cave Creek Rd Unit 2035
- 10410 N Cave Creek Rd Unit 2229
- 10402 N 11th St Unit 1
- 10402 N 11th St Unit 2
- 1101 E North Ln Unit 1
- 1101 E North Ln Unit 2
- 10408 N 11th St
- 10408 N 11th St Unit 1
- 10408 N 11th St Unit 3
- 10407 N 11th St Unit 3
- 10407 N 11th St Unit 2
- 10407 N 11th St Unit 1
- 10407 N 11th St Unit 3
- 1107 E North Ln Unit 3
- 1107 E North Ln Unit 1
- 1107 E North Ln Unit 2
- 1114 E Cochise Dr
- 1110 E Cochise Dr
- 1118 E Cochise Dr
- 1106 E Cochise Dr
- 1122 E Cochise Dr
- 1102 E Cochise Dr