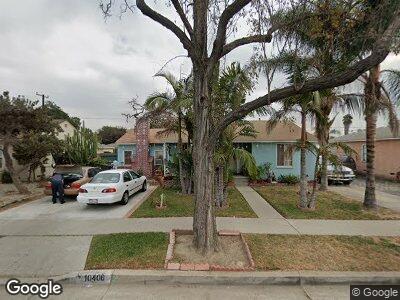
10406 Renoa Ave South Gate, CA 90280
Estimated Value: $667,286 - $772,000
3
Beds
2
Baths
1,163
Sq Ft
$612/Sq Ft
Est. Value
About This Home
This home is located at 10406 Renoa Ave, South Gate, CA 90280 and is currently estimated at $711,572, approximately $611 per square foot. 10406 Renoa Ave is a home located in Los Angeles County with nearby schools including Old River Elementary School, Williams Elementary School, and West Middle School.
Ownership History
Date
Name
Owned For
Owner Type
Purchase Details
Closed on
Oct 27, 2004
Sold by
Reyes Roberto P and Reyes Ramon Ponce
Bought by
Reyes Roberto P
Current Estimated Value
Home Financials for this Owner
Home Financials are based on the most recent Mortgage that was taken out on this home.
Original Mortgage
$195,000
Interest Rate
5.76%
Mortgage Type
Unknown
Purchase Details
Closed on
Apr 16, 2003
Sold by
Martinez Maria
Bought by
Reyes Ramon Ponce
Purchase Details
Closed on
Mar 6, 2003
Sold by
Reyes Maria
Bought by
Reyes Roberto P
Home Financials for this Owner
Home Financials are based on the most recent Mortgage that was taken out on this home.
Original Mortgage
$200,000
Interest Rate
5.72%
Purchase Details
Closed on
Feb 12, 2003
Sold by
Hastrup Alicia M and Alicia M Hastrup Living Trust
Bought by
Reyes Roberto P
Home Financials for this Owner
Home Financials are based on the most recent Mortgage that was taken out on this home.
Original Mortgage
$200,000
Interest Rate
5.72%
Create a Home Valuation Report for This Property
The Home Valuation Report is an in-depth analysis detailing your home's value as well as a comparison with similar homes in the area
Home Values in the Area
Average Home Value in this Area
Purchase History
| Date | Buyer | Sale Price | Title Company |
|---|---|---|---|
| Reyes Roberto P | -- | -- | |
| Reyes Ramon Ponce | -- | -- | |
| Reyes Roberto P | -- | -- | |
| Reyes Roberto P | $225,000 | Fatcola |
Source: Public Records
Mortgage History
| Date | Status | Borrower | Loan Amount |
|---|---|---|---|
| Open | Reyes Roberto P | $163,350 | |
| Closed | Reyes Roberto P | $195,000 | |
| Previous Owner | Reyes Roberto P | $200,000 |
Source: Public Records
Tax History Compared to Growth
Tax History
| Year | Tax Paid | Tax Assessment Tax Assessment Total Assessment is a certain percentage of the fair market value that is determined by local assessors to be the total taxable value of land and additions on the property. | Land | Improvement |
|---|---|---|---|---|
| 2024 | $5,740 | $424,154 | $286,888 | $137,266 |
| 2023 | $5,513 | $415,838 | $281,263 | $134,575 |
| 2022 | $5,245 | $407,686 | $275,749 | $131,937 |
| 2021 | $5,152 | $399,693 | $270,343 | $129,350 |
| 2019 | $5,023 | $387,839 | $262,325 | $125,514 |
| 2018 | $4,881 | $380,235 | $257,182 | $123,053 |
| 2016 | $4,737 | $365,473 | $247,197 | $118,276 |
| 2015 | $4,673 | $359,984 | $243,484 | $116,500 |
| 2014 | $4,422 | $352,933 | $238,715 | $114,218 |
Source: Public Records
Map
Nearby Homes
- 10506 Garfield Ave
- 10245 Garfield Ave
- 5700 Glady St
- 10608 Beak Ave
- 10024 Karmont Ave
- 10026 Karmont Ave
- 9930 Karmont Ave
- 9936 Karmont Ave
- 7312 Quill Dr Unit 13
- 7314 Quill Dr Unit 155
- 7340 Quill Dr Unit 81
- 7302 Quill Dr Unit 198
- 7304 Quill Dr Unit 180
- 10929 Amery Ave
- 10001 W Frontage Rd Unit 188
- 10001 W Frontage Rd Unit 117
- 10001 W Frontage Rd Unit 64
- 12106 Old River School Rd Unit G
- 10814 Saint James Ave
- 7033 Stewart And Gray Rd Unit 6
- 10406 Renoa Ave
- 10412 Renoa Ave
- 10400 Renoa Ave
- 10409 Richlee Ave
- 10415 Richlee Ave
- 10418 Renoa Ave
- 10403 Richlee Ave
- 10421 Richlee Ave
- 10407 Renoa Ave
- 10413 Renoa Ave
- 10427 Richlee Ave
- 10401 Renoa Ave
- 10350 Renoa Ave
- 10425 Renoa Ave
- 10424 Renoa Ave
- 10355 Renoa Ave
- 10333 Richlee Ave
- 10431 Richlee Ave
- 10346 Renoa Ave
- 10351 Renoa Ave