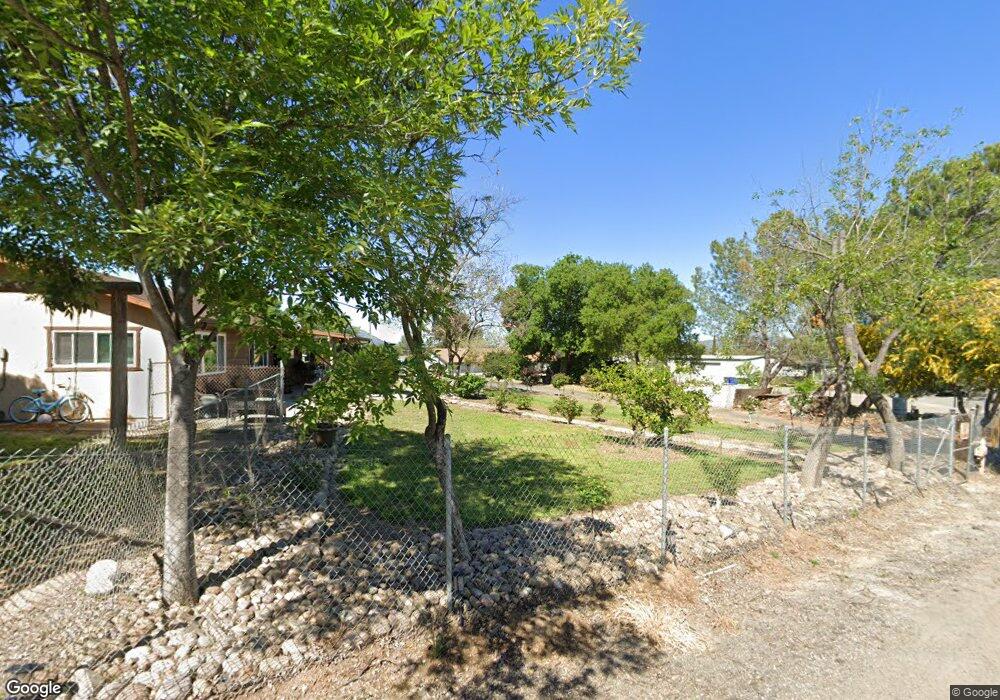
1041 10th St Ramona, CA 92065
Estimated Value: $697,000 - $753,000
3
Beds
2
Baths
1,718
Sq Ft
$424/Sq Ft
Est. Value
About This Home
This home is located at 1041 10th St, Ramona, CA 92065 and is currently estimated at $727,773, approximately $423 per square foot. 1041 10th St is a home located in San Diego County with nearby schools including Ramona Elementary School, Olive Peirce Middle School, and Ramona High School.
Ownership History
Date
Name
Owned For
Owner Type
Purchase Details
Closed on
Dec 19, 1996
Sold by
Guzik Patricia A
Bought by
Guzik Paul C
Current Estimated Value
Home Financials for this Owner
Home Financials are based on the most recent Mortgage that was taken out on this home.
Original Mortgage
$163,200
Interest Rate
7.46%
Mortgage Type
VA
Purchase Details
Closed on
Nov 21, 1996
Sold by
Guzik Paul C
Bought by
Duncan David D and Yorba Duncan Yolanda
Home Financials for this Owner
Home Financials are based on the most recent Mortgage that was taken out on this home.
Original Mortgage
$163,200
Interest Rate
7.46%
Mortgage Type
VA
Purchase Details
Closed on
Oct 2, 1996
Sold by
Smith James E and Smith Cynthia L
Bought by
Guzik Paul C
Home Financials for this Owner
Home Financials are based on the most recent Mortgage that was taken out on this home.
Original Mortgage
$163,200
Interest Rate
7.46%
Mortgage Type
VA
Create a Home Valuation Report for This Property
The Home Valuation Report is an in-depth analysis detailing your home's value as well as a comparison with similar homes in the area
Home Values in the Area
Average Home Value in this Area
Purchase History
| Date | Buyer | Sale Price | Title Company |
|---|---|---|---|
| Guzik Paul C | -- | Fidelity National Title Co | |
| Duncan David D | $160,000 | Fidelity National Title Co | |
| Guzik Paul C | -- | -- |
Source: Public Records
Mortgage History
| Date | Status | Borrower | Loan Amount |
|---|---|---|---|
| Previous Owner | Duncan David D | $163,200 |
Source: Public Records
Tax History Compared to Growth
Tax History
| Year | Tax Paid | Tax Assessment Tax Assessment Total Assessment is a certain percentage of the fair market value that is determined by local assessors to be the total taxable value of land and additions on the property. | Land | Improvement |
|---|---|---|---|---|
| 2025 | $2,848 | $260,565 | $113,995 | $146,570 |
| 2024 | $2,848 | $255,457 | $111,760 | $143,697 |
| 2023 | $2,600 | $250,449 | $109,569 | $140,880 |
| 2022 | $2,749 | $245,539 | $107,421 | $138,118 |
| 2021 | $2,701 | $240,725 | $105,315 | $135,410 |
| 2020 | $2,674 | $238,258 | $104,236 | $134,022 |
| 2019 | $2,610 | $233,588 | $102,193 | $131,395 |
| 2018 | $2,542 | $229,009 | $100,190 | $128,819 |
| 2017 | $2,493 | $224,520 | $98,226 | $126,294 |
| 2016 | $2,444 | $220,118 | $96,300 | $123,818 |
| 2015 | $2,410 | $216,813 | $94,854 | $121,959 |
| 2014 | $2,356 | $212,566 | $92,996 | $119,570 |
Source: Public Records
Map
Nearby Homes
- 1121 11th St
- 19630 Camino Vista Unit 191
- 915 9th St
- 1212 H St Unit 121
- 1212 H St Unit SPC 149
- 1212 H St Unit 38
- 1212 H St Unit 202
- 1212 H St Unit 110
- 1212 H St Unit 55
- 1212 H St Unit 95
- 1212 H St Unit 146
- 1212 H St Unit 48
- 1212 H St Unit 187
- 1212 H St Unit 21
- 1212 H St Unit 157
- 0 Camino Arriba Unit 3 250034073
- 40 acres Sutherland Dam Rd
- 1308 Oak Village Dr
- 615 10th St
- 722 8th St