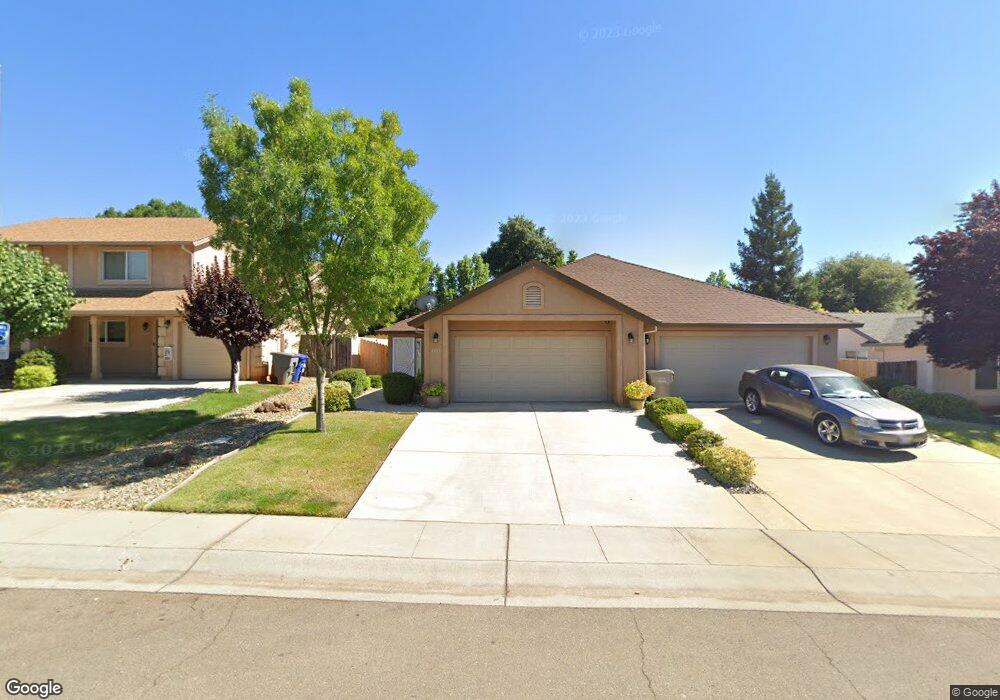
1041 Monterra Ln Redding, CA 96002
Enterprise NeighborhoodEstimated Value: $484,604 - $564,000
2
Beds
2
Baths
2,560
Sq Ft
$211/Sq Ft
Est. Value
About This Home
This home is located at 1041 Monterra Ln, Redding, CA 96002 and is currently estimated at $539,401, approximately $210 per square foot. 1041 Monterra Ln is a home located in Shasta County with nearby schools including Lassen View Elementary School, Parsons Junior High School, and Enterprise High School.
Ownership History
Date
Name
Owned For
Owner Type
Purchase Details
Closed on
Oct 4, 2010
Sold by
Ballew Robin M and Ballew Harold L
Bought by
Ballew Robin M and Ballew Harold L
Current Estimated Value
Purchase Details
Closed on
Mar 14, 2006
Sold by
Red Rock Investments
Bought by
Penn Patricia D and Ballew Harold L
Home Financials for this Owner
Home Financials are based on the most recent Mortgage that was taken out on this home.
Original Mortgage
$242,000
Outstanding Balance
$136,930
Interest Rate
6.19%
Mortgage Type
Fannie Mae Freddie Mac
Estimated Equity
$402,471
Create a Home Valuation Report for This Property
The Home Valuation Report is an in-depth analysis detailing your home's value as well as a comparison with similar homes in the area
Home Values in the Area
Average Home Value in this Area
Purchase History
| Date | Buyer | Sale Price | Title Company |
|---|---|---|---|
| Ballew Robin M | -- | None Available | |
| Penn Patricia | -- | None Available | |
| Penn Patricia D | $395,000 | First American Title Co |
Source: Public Records
Mortgage History
| Date | Status | Borrower | Loan Amount |
|---|---|---|---|
| Open | Penn Patricia D | $242,000 |
Source: Public Records
Tax History Compared to Growth
Tax History
| Year | Tax Paid | Tax Assessment Tax Assessment Total Assessment is a certain percentage of the fair market value that is determined by local assessors to be the total taxable value of land and additions on the property. | Land | Improvement |
|---|---|---|---|---|
| 2025 | $5,508 | $475,000 | $75,000 | $400,000 |
| 2024 | $5,504 | $475,000 | $75,000 | $400,000 |
| 2023 | $5,504 | $475,000 | $75,000 | $400,000 |
| 2022 | $4,755 | $420,000 | $80,000 | $340,000 |
| 2021 | $4,347 | $390,000 | $80,000 | $310,000 |
| 2020 | $4,342 | $390,000 | $80,000 | $310,000 |
| 2019 | $4,436 | $390,000 | $80,000 | $310,000 |
| 2018 | $4,304 | $375,000 | $60,000 | $315,000 |
| 2017 | $4,264 | $350,000 | $60,000 | $290,000 |
| 2016 | $2,943 | $260,000 | $50,000 | $210,000 |
| 2015 | $2,762 | $245,000 | $50,000 | $195,000 |
| 2014 | $2,519 | $225,000 | $40,000 | $185,000 |
Source: Public Records
Map
Nearby Homes
- 1000 Monterra Ln
- 1198 Denton Way
- 3703 Harrow Ct
- 1153 Ruthie Ln
- 1201 Echo Rd
- 3591 Adams Ln
- 4323 Churn Crk Rd
- 4218 Jane St
- 3690 Victoire Way
- 855 Jefferson Ct
- 3710 Indio Way
- 723 Woodacre Dr
- 953 Camino Ct
- 3527 Adams Ln
- 952 Camino Ct
- 3708 Traverse St
- 609 Dee Ct
- 3540 Ricardo Ave
- 595 Rafael St
- 4463 Pike Ct
- 1039 Monterra Ln
- 1045 Monterra Ln
- 1033 Monterra Ln
- 1051 Monterra Ln
- 1027 Monterra Ln
- 1036 Monterra Ln
- 1040 Monterra Ln
- 1112 Lorraine Dr
- 1057 Monterra Ln
- 1030 Monterra Ln
- 1046 Monterra Ln
- 1021 Monterra Ln
- 1132 Lorraine Dr
- 1098 Lorraine Dr
- Lot 5 Monterra Ln
- 1026 Monterra Ln
- 1050 Monterra Ln
- 1063 Monterra Ln
- 1084 Lorraine Dr
- 1148 Lorraine Dr