10411 NW 110th St Mc Cune, KS 66753
Estimated Value: $331,000 - $495,852
4
Beds
3
Baths
3,325
Sq Ft
$124/Sq Ft
Est. Value
About This Home
This home is located at 10411 NW 110th St, Mc Cune, KS 66753 and is currently estimated at $413,426, approximately $124 per square foot. 10411 NW 110th St is a home located in Cherokee County with nearby schools including Southeast High School.
Ownership History
Date
Name
Owned For
Owner Type
Purchase Details
Closed on
Nov 1, 1993
Bought by
Underwood Van E and Underwood Tara L
Current Estimated Value
Create a Home Valuation Report for This Property
The Home Valuation Report is an in-depth analysis detailing your home's value as well as a comparison with similar homes in the area
Home Values in the Area
Average Home Value in this Area
Purchase History
| Date | Buyer | Sale Price | Title Company |
|---|---|---|---|
| Underwood Van E | $83,000 | -- |
Source: Public Records
Tax History Compared to Growth
Tax History
| Year | Tax Paid | Tax Assessment Tax Assessment Total Assessment is a certain percentage of the fair market value that is determined by local assessors to be the total taxable value of land and additions on the property. | Land | Improvement |
|---|---|---|---|---|
| 2024 | $6,309 | $74,358 | $10,589 | $63,769 |
| 2023 | $6,060 | $68,610 | $11,228 | $57,382 |
| 2022 | $4,910 | $57,335 | $11,866 | $45,469 |
| 2021 | $0 | $55,619 | $11,638 | $43,981 |
| 2020 | $6,195 | $60,223 | $11,173 | $49,050 |
| 2019 | $6,256 | $60,573 | $11,156 | $49,417 |
| 2018 | $4,308 | $41,958 | $10,647 | $31,311 |
| 2017 | $4,449 | $42,445 | $10,008 | $32,437 |
| 2016 | $4,351 | $42,967 | $8,667 | $34,300 |
| 2015 | -- | $43,441 | $7,859 | $35,582 |
| 2014 | -- | $39,216 | $6,926 | $32,290 |
Source: Public Records
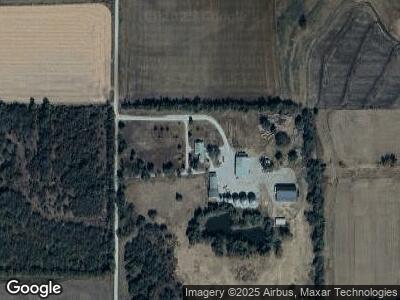
Map
Nearby Homes
- 411 5th St
- 0 NW Coal Valley Rd
- 00000 Us 400 Hwy
- 7136 NW 125th St
- 24104 Xavier Rd
- 0 S 20th St
- 112 Janett St
- 1317 W 560th Ave
- 0 NW Star Valley Rd
- 0000 NW Belleview Rd
- 0 NW Belleview Rd
- 0 S 90th St
- 1734 24000 Rd
- 415 Pecan St
- 311 W Larch St
- 321 Kay Ln
- 305 W Pine St
- 22155 70th Rd
- 417 Crestview Dr
- 430 Crestview Dr