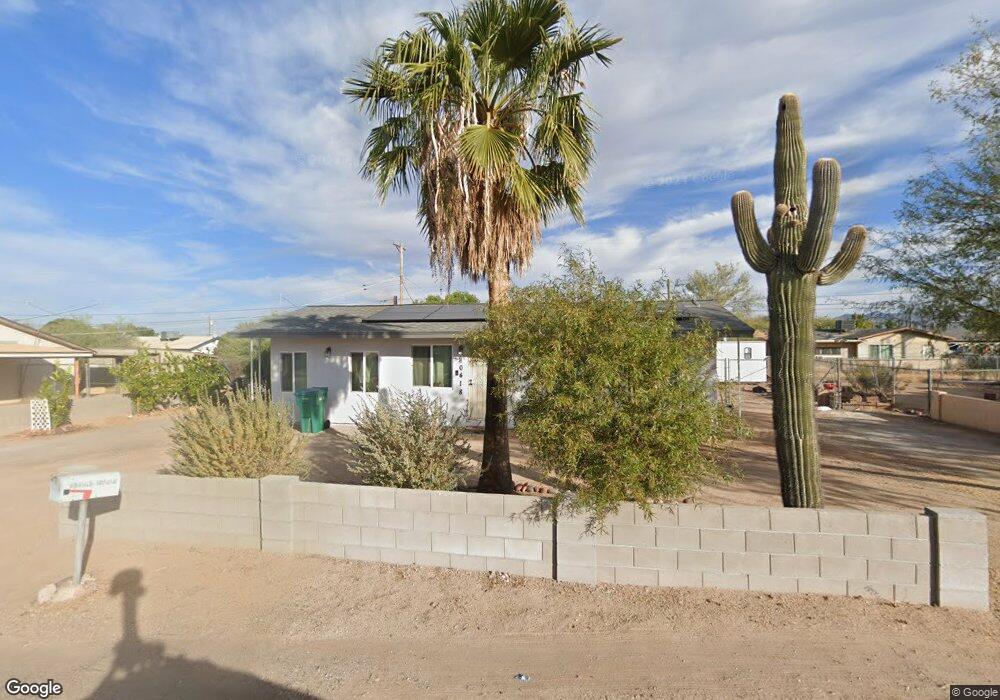
10418 E Akron St Apache Junction, AZ 85120
University Manor NeighborhoodEstimated Value: $233,243 - $294,000
3
Beds
2
Baths
880
Sq Ft
$309/Sq Ft
Est. Value
About This Home
This home is located at 10418 E Akron St, Apache Junction, AZ 85120 and is currently estimated at $271,561, approximately $308 per square foot. 10418 E Akron St is a home located in Maricopa County with nearby schools including Sousa Elementary School, Franklin at Brimhall Elementary School, and Franklin West Elementary School.
Ownership History
Date
Name
Owned For
Owner Type
Purchase Details
Closed on
Oct 3, 2003
Sold by
Ruiz Rosalba
Bought by
Ruiz Irad
Current Estimated Value
Home Financials for this Owner
Home Financials are based on the most recent Mortgage that was taken out on this home.
Original Mortgage
$85,000
Outstanding Balance
$43,370
Interest Rate
7.59%
Mortgage Type
Purchase Money Mortgage
Estimated Equity
$228,191
Purchase Details
Closed on
Sep 12, 2003
Sold by
Huhn David S
Bought by
Ruiz Irad
Home Financials for this Owner
Home Financials are based on the most recent Mortgage that was taken out on this home.
Original Mortgage
$85,000
Outstanding Balance
$43,370
Interest Rate
7.59%
Mortgage Type
Purchase Money Mortgage
Estimated Equity
$228,191
Purchase Details
Closed on
Oct 30, 2002
Sold by
Huhn Corrine M
Bought by
Huhn David S
Purchase Details
Closed on
Oct 15, 2002
Sold by
Casey Charlotte
Bought by
Huhn David S
Create a Home Valuation Report for This Property
The Home Valuation Report is an in-depth analysis detailing your home's value as well as a comparison with similar homes in the area
Home Values in the Area
Average Home Value in this Area
Purchase History
| Date | Buyer | Sale Price | Title Company |
|---|---|---|---|
| Ruiz Irad | -- | Transnation Title Ins Co | |
| Ruiz Irad | $85,000 | Transnation Title Ins Co | |
| Huhn David S | -- | Transnation Title Insurance | |
| Huhn David S | $70,000 | Transnation Title Insurance |
Source: Public Records
Mortgage History
| Date | Status | Borrower | Loan Amount |
|---|---|---|---|
| Open | Ruiz Irad | $85,000 | |
| Closed | Ruiz Irad | $85,000 |
Source: Public Records
Tax History
| Year | Tax Paid | Tax Assessment Tax Assessment Total Assessment is a certain percentage of the fair market value that is determined by local assessors to be the total taxable value of land and additions on the property. | Land | Improvement |
|---|---|---|---|---|
| 2025 | $353 | $4,738 | -- | -- |
| 2024 | $361 | $4,512 | -- | -- |
| 2023 | $361 | $16,820 | $3,360 | $13,460 |
| 2022 | $352 | $13,200 | $2,640 | $10,560 |
| 2021 | $356 | $11,220 | $2,240 | $8,980 |
| 2020 | $353 | $9,460 | $1,890 | $7,570 |
| 2019 | $324 | $8,830 | $1,760 | $7,070 |
| 2018 | $315 | $7,570 | $1,510 | $6,060 |
| 2017 | $303 | $5,430 | $1,080 | $4,350 |
| 2016 | $297 | $4,660 | $930 | $3,730 |
| 2015 | $279 | $3,830 | $760 | $3,070 |
Source: Public Records
Map
Nearby Homes
- 10411 E 1st St
- 146 N Merrill Rd Unit 163
- 146 N Merrill Rd Unit 64
- 146 N Merrill Rd Unit 71
- 146 N Merrill Rd Unit 165
- 146 N Merrill Rd Unit 21
- 146 N Merrill Rd Unit 20
- 146 N Merrill Rd Unit 2
- 146 N Merrill Rd Unit 85
- 146 N Merrill Rd Unit 146
- 146 N Merrill Rd Unit 107
- 146 N Merrill Rd Unit 73
- 146 N Merrill Rd Unit 90
- 146 N Merrill Rd Unit 68
- 146 N Merrill Rd Unit 155
- 10540 E Apache Trail Unit 15
- 10540 E Apache Trail Unit 6
- 10540 E Apache Trail Unit 91
- 10540 E Apache Trail Unit 93
- 10540 E Apache Trail Unit 127
- 10420 E Akron St
- 10414 E Akron St
- 10417 E Albany St
- 10427 E Albany St
- 10409 E Albany St
- 10419 E Akron St
- 10402 E Akron St
- 10434 E Akron St
- 10411 E Akron St
- 10401 E Albany St
- 10433 E Albany St
- 10403 E Akron St
- 10403 E Akron St
- 10423 E Akron St
- 10418 E Albany St
- 10420 E 1st St
- 10444 E Akron St
- 10410 E Albany St
- 10426 E Albany St
- 10358 E Akron St
Your Personal Tour Guide
Ask me questions while you tour the home.