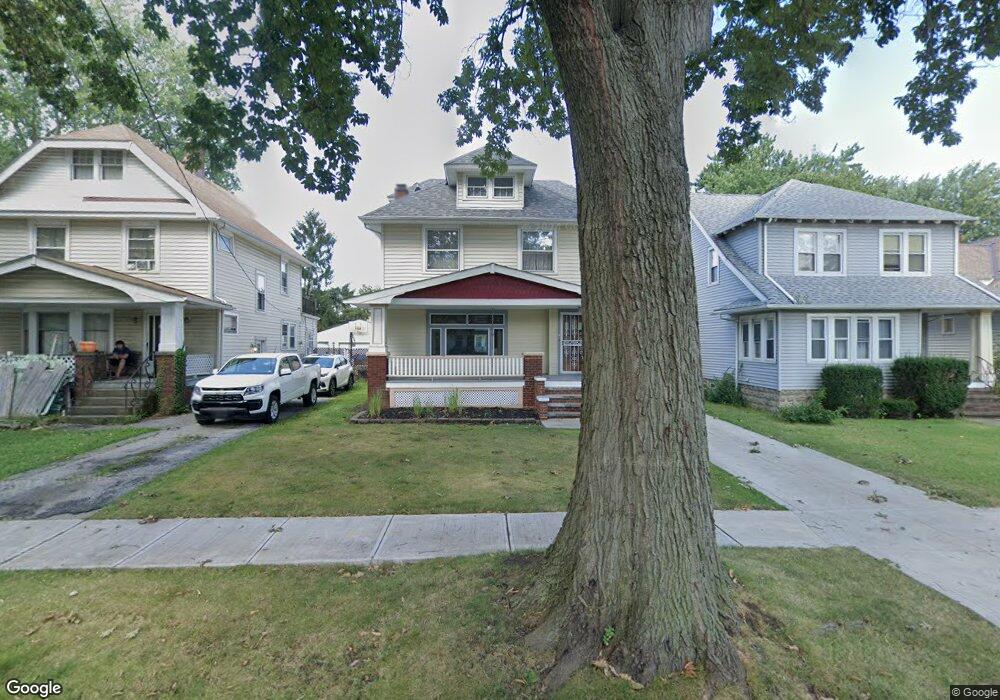
10418 Fidelity Ave Cleveland, OH 44111
West Boulevard NeighborhoodEstimated Value: $141,531 - $167,000
4
Beds
1
Bath
1,563
Sq Ft
$99/Sq Ft
Est. Value
About This Home
This home is located at 10418 Fidelity Ave, Cleveland, OH 44111 and is currently estimated at $155,383, approximately $99 per square foot. 10418 Fidelity Ave is a home located in Cuyahoga County with nearby schools including Almira Academy, Artemus Ward School, and Anton Grdina School.
Ownership History
Date
Name
Owned For
Owner Type
Purchase Details
Closed on
Sep 19, 2023
Sold by
Nguyen Hung and Nguyen Anh
Bought by
Hung Nguyen And Anh Nguyen Revocable Living T and Nhuyen
Current Estimated Value
Purchase Details
Closed on
Jul 31, 1996
Sold by
Kiefer Anthony J
Bought by
Nguyen Hung and Nguyen Anh
Home Financials for this Owner
Home Financials are based on the most recent Mortgage that was taken out on this home.
Original Mortgage
$68,950
Interest Rate
8.33%
Mortgage Type
New Conventional
Purchase Details
Closed on
Apr 16, 1992
Sold by
Avis Bonnie E
Bought by
Kiefer Anthony J
Purchase Details
Closed on
Feb 5, 1991
Sold by
Avis Robert J
Bought by
Avis Bonnie E
Purchase Details
Closed on
Aug 30, 1989
Sold by
Zabor Beverly L
Bought by
Avis Robert J
Purchase Details
Closed on
Sep 6, 1985
Sold by
Lewis Alice J
Bought by
Lewis Alice J
Purchase Details
Closed on
Jan 1, 1975
Bought by
Lewis Alice J
Create a Home Valuation Report for This Property
The Home Valuation Report is an in-depth analysis detailing your home's value as well as a comparison with similar homes in the area
Home Values in the Area
Average Home Value in this Area
Purchase History
| Date | Buyer | Sale Price | Title Company |
|---|---|---|---|
| Hung Nguyen And Anh Nguyen Revocable Living T | -- | None Listed On Document | |
| Nguyen Hung | $74,900 | -- | |
| Kiefer Anthony J | $55,000 | -- | |
| Avis Bonnie E | -- | -- | |
| Avis Robert J | $45,000 | -- | |
| Zabor Beverly L | -- | -- | |
| Lewis Alice J | -- | -- | |
| Lewis Alice J | -- | -- |
Source: Public Records
Mortgage History
| Date | Status | Borrower | Loan Amount |
|---|---|---|---|
| Previous Owner | Nguyen Hung | $68,950 |
Source: Public Records
Tax History Compared to Growth
Tax History
| Year | Tax Paid | Tax Assessment Tax Assessment Total Assessment is a certain percentage of the fair market value that is determined by local assessors to be the total taxable value of land and additions on the property. | Land | Improvement |
|---|---|---|---|---|
| 2024 | $2,013 | $40,495 | $9,450 | $31,045 |
| 2023 | $1,606 | $30,350 | $5,880 | $24,470 |
| 2022 | $1,629 | $30,345 | $5,880 | $24,465 |
| 2021 | $1,613 | $30,350 | $5,880 | $24,470 |
| 2020 | $1,261 | $23,350 | $4,520 | $18,830 |
| 2019 | $1,166 | $66,700 | $12,900 | $53,800 |
| 2018 | $1,177 | $23,350 | $4,520 | $18,830 |
| 2017 | $1,201 | $23,320 | $3,820 | $19,500 |
| 2016 | $1,192 | $23,320 | $3,820 | $19,500 |
| 2015 | $1,363 | $23,320 | $3,820 | $19,500 |
| 2014 | $1,363 | $25,350 | $4,170 | $21,180 |
Source: Public Records
Map
Nearby Homes
- 10402 Almira Ave
- 10225 Bernard Ave
- 10310 Adelaide Ave
- 10216 Champion Ave
- 10404 Joan Ave
- 3301 West Blvd
- 10914 Fidelity Ave
- 3380 W 100th St
- 10113 Loretta Ave
- 3296 W 99th St
- 3172 W 105th St
- 3329 W 99th St
- 10612 Linnet Ave
- 3515 W 100th St
- 3410 Bosworth Rd
- 3325 W 98th St
- 3512 W 98th St
- 11317 Headley Ave
- 10710 Dale Ave
- 11101 Fortune Ave
- 10422 Fidelity Ave
- 10414 Fidelity Ave
- 10426 Fidelity Ave
- 10410 Fidelity Ave
- 10408 Fidelity Ave
- 10417 Almira Ave
- 10421 Almira Ave
- 10413 Almira Ave
- 10425 Almira Ave
- 10425 Almira Ave Unit UP
- 10409 Almira Ave
- 10402 Fidelity Ave
- 10429 Almira Ave
- 10405 Almira Ave
- 10409 Fidelity Ave
- 10413 Fidelity Ave
- 10417 Fidelity Ave
- 10330 Fidelity Ave
- 10425 Fidelity Ave
- 10401 Almira Ave