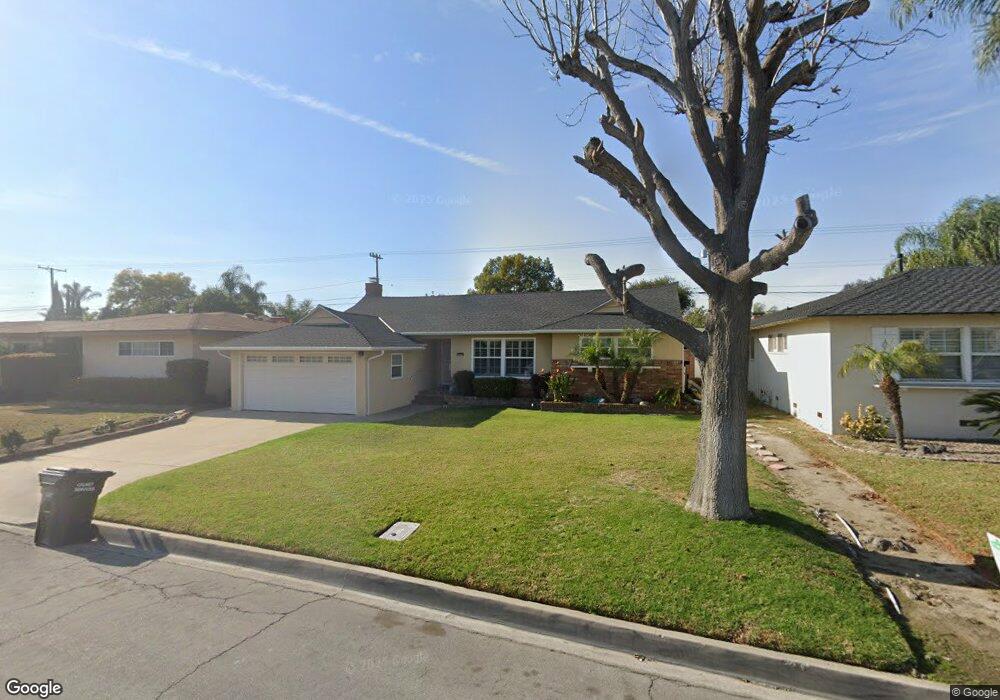
10419 Pico Vista Rd Downey, CA 90241
Estimated Value: $983,989 - $1,135,000
3
Beds
2
Baths
1,540
Sq Ft
$672/Sq Ft
Est. Value
About This Home
This home is located at 10419 Pico Vista Rd, Downey, CA 90241 and is currently estimated at $1,034,997, approximately $672 per square foot. 10419 Pico Vista Rd is a home located in Los Angeles County with nearby schools including Rio San Gabriel Elementary School, Doty Middle School, and Downey High School.
Ownership History
Date
Name
Owned For
Owner Type
Purchase Details
Closed on
Aug 24, 2010
Sold by
Charles Sven and Augimeri Suzanne Rae
Bought by
Augimeri Sven Charles and Augimeri Suzanne Rae
Current Estimated Value
Home Financials for this Owner
Home Financials are based on the most recent Mortgage that was taken out on this home.
Original Mortgage
$280,000
Outstanding Balance
$183,603
Interest Rate
4.38%
Mortgage Type
New Conventional
Estimated Equity
$851,394
Purchase Details
Closed on
Sep 12, 2008
Sold by
Willick Louise E and The Willick Family Living Trus
Bought by
Feitknecht Sven C and Augimeri Suzanne R
Home Financials for this Owner
Home Financials are based on the most recent Mortgage that was taken out on this home.
Original Mortgage
$300,000
Interest Rate
6.49%
Mortgage Type
Purchase Money Mortgage
Purchase Details
Closed on
Sep 16, 1999
Sold by
Willick Edward L and Willick Louise E
Bought by
Willick Edward L and Willick Louise E
Create a Home Valuation Report for This Property
The Home Valuation Report is an in-depth analysis detailing your home's value as well as a comparison with similar homes in the area
Home Values in the Area
Average Home Value in this Area
Purchase History
| Date | Buyer | Sale Price | Title Company |
|---|---|---|---|
| Augimeri Sven Charles | -- | Lawyers Title | |
| Feitknecht Sven C | $475,000 | Fidelity National Title Co | |
| Willick Edward L | -- | -- |
Source: Public Records
Mortgage History
| Date | Status | Borrower | Loan Amount |
|---|---|---|---|
| Open | Augimeri Sven Charles | $280,000 | |
| Closed | Feitknecht Sven C | $300,000 |
Source: Public Records
Tax History Compared to Growth
Tax History
| Year | Tax Paid | Tax Assessment Tax Assessment Total Assessment is a certain percentage of the fair market value that is determined by local assessors to be the total taxable value of land and additions on the property. | Land | Improvement |
|---|---|---|---|---|
| 2025 | $7,648 | $611,672 | $452,255 | $159,417 |
| 2024 | $7,648 | $599,680 | $443,388 | $156,292 |
| 2023 | $7,388 | $587,923 | $434,695 | $153,228 |
| 2022 | $7,018 | $576,396 | $426,172 | $150,224 |
| 2021 | $6,868 | $565,095 | $417,816 | $147,279 |
| 2019 | $6,691 | $548,335 | $405,424 | $142,911 |
| 2018 | $6,461 | $537,584 | $397,475 | $140,109 |
| 2016 | $6,268 | $516,711 | $382,042 | $134,669 |
| 2015 | $6,179 | $508,951 | $376,304 | $132,647 |
| 2014 | $5,827 | $498,982 | $368,933 | $130,049 |
Source: Public Records
Map
Nearby Homes
- 10502 Pangborn Ave
- 10040 Mattock Ave
- 11010 Studebaker Rd
- 9356 Buell St
- 9359 Cecilia St
- 10919 Newville Ave
- 9326 Via Amorita
- 10233 Cord Ave
- 11224 Studebaker Rd
- 9363 Dinsdale St
- 10924 Dalwood Ave
- 10829 Cord Ave
- 9433 Dacosta St
- 10929 Casanes Ave
- 9249 Buell St
- 10558 Brierbush Ave
- 9215 Buell St
- 11229 Glenworth St
- 11221 Pangborn Ave
- 11102 Woodruff Ave Unit 10
- 10415 Pico Vista Rd
- 10427 Pico Vista Rd
- 10409 Pico Vista Rd
- 10433 Pico Vista Rd
- 10418 Lesterford Ave
- 10426 Lesterford Ave
- 10414 Lesterford Ave
- 10432 Lesterford Ave
- 10420 Pico Vista Rd
- 10401 Pico Vista Rd
- 10428 Pico Vista Rd
- 10408 Lesterford Ave
- 10414 Pico Vista Rd
- 10438 Lesterford Ave
- 10441 Pico Vista Rd
- 10434 Pico Vista Rd
- 10406 Pico Vista Rd
- 10402 Lesterford Ave
- 10444 Lesterford Ave
- 0 Lesterford Ave Unit PW18074116