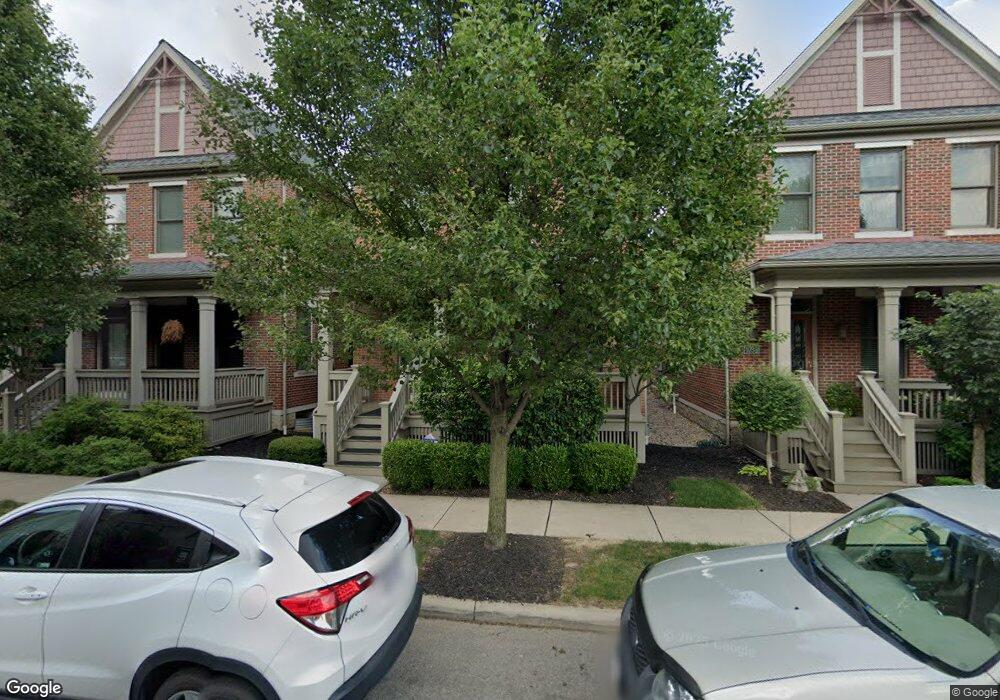
1042 Harrison Park Place Columbus, OH 43201
Harrison West NeighborhoodEstimated Value: $857,000 - $942,000
4
Beds
5
Baths
3,321
Sq Ft
$269/Sq Ft
Est. Value
About This Home
This home is located at 1042 Harrison Park Place, Columbus, OH 43201 and is currently estimated at $891,797, approximately $268 per square foot. 1042 Harrison Park Place is a home located in Franklin County with nearby schools including Hubbard Elementary School, Dominion Middle School, and Whetstone High School.
Ownership History
Date
Name
Owned For
Owner Type
Purchase Details
Closed on
Jan 14, 2021
Sold by
Kollesser Jeffrey A
Bought by
Wackerman Ryan
Current Estimated Value
Home Financials for this Owner
Home Financials are based on the most recent Mortgage that was taken out on this home.
Original Mortgage
$506,000
Outstanding Balance
$451,289
Interest Rate
2.67%
Mortgage Type
New Conventional
Estimated Equity
$440,508
Purchase Details
Closed on
Dec 14, 2007
Sold by
Harrison Park Development Ltd
Bought by
Kollesser Jeffrey A
Home Financials for this Owner
Home Financials are based on the most recent Mortgage that was taken out on this home.
Original Mortgage
$403,456
Interest Rate
6.31%
Mortgage Type
Purchase Money Mortgage
Create a Home Valuation Report for This Property
The Home Valuation Report is an in-depth analysis detailing your home's value as well as a comparison with similar homes in the area
Home Values in the Area
Average Home Value in this Area
Purchase History
| Date | Buyer | Sale Price | Title Company |
|---|---|---|---|
| Wackerman Ryan | $675,000 | Valmer Land Title Agency | |
| Kollesser Jeffrey A | $504,400 | Principle T |
Source: Public Records
Mortgage History
| Date | Status | Borrower | Loan Amount |
|---|---|---|---|
| Open | Wackerman Ryan | $506,000 | |
| Previous Owner | Kollesser Jeffrey A | $403,456 |
Source: Public Records
Tax History Compared to Growth
Tax History
| Year | Tax Paid | Tax Assessment Tax Assessment Total Assessment is a certain percentage of the fair market value that is determined by local assessors to be the total taxable value of land and additions on the property. | Land | Improvement |
|---|---|---|---|---|
| 2024 | $13,149 | $283,640 | $31,500 | $252,140 |
| 2023 | $12,986 | $283,640 | $31,500 | $252,140 |
| 2022 | $11,983 | $222,670 | $36,750 | $185,920 |
| 2021 | $11,569 | $222,670 | $36,750 | $185,920 |
| 2020 | $11,584 | $222,670 | $36,750 | $185,920 |
| 2019 | $12,863 | $212,030 | $35,000 | $177,030 |
| 2018 | $6,418 | $212,030 | $35,000 | $177,030 |
| 2017 | $4,804 | $212,030 | $35,000 | $177,030 |
| 2016 | $4,637 | $175,000 | $35,000 | $140,000 |
| 2015 | $4,209 | $175,000 | $35,000 | $140,000 |
| 2014 | $4,220 | $175,000 | $35,000 | $140,000 |
| 2013 | $89 | $3,010 | $3,010 | $0 |
Source: Public Records
Map
Nearby Homes
- 0 Bradley St
- 1025 Oregon Ave
- 539 W 1st Ave Unit 310
- 537 W 3rd Ave Unit 537
- 475 W 2nd Ave
- 496 W 1st Ave
- 953 Ingleside Ave Unit 314
- 925 Ingleside Ave Unit 111
- 925 Ingleside Ave Unit 213
- 925 Ingleside Ave Unit 303
- 1173 Perry St Unit 20P
- 1003 Pennsylvania Ave Unit 5
- 477 W 4th Ave
- 502 Riverfront Ln
- 506 Riverfront Ln
- 516 Riverfront Ln
- 512 Riverfront Ln
- 337 Tappan St
- 994 Harrison Ave
- 319 W 2nd Ave Unit 319
- 1038 Harrison Park Place
- 1046 Harrison Park Place
- 1050 Harrison Park Place
- 1034 Harrison Park Place
- 1030 Harrison Park Place
- 1054 Harrison Park Place
- 1054 Harrison Park Place Unit 58
- 1037 Harrison Park Place
- 1045 Harrison Park Place
- 1026 Harrison Park Place
- 1058 Harrison Park Place Unit 59-105
- 1058 Harrison Park Place
- 1033 Harrison Park Place
- 1049 Harrison Park Place
- 1053 Harrison Park Place
- 591 W 2nd Ave
- 1039 Perry St Unit 31-103
- 1039 Perry St
- 1022 Harrison Park Place
- 1035 Perry St