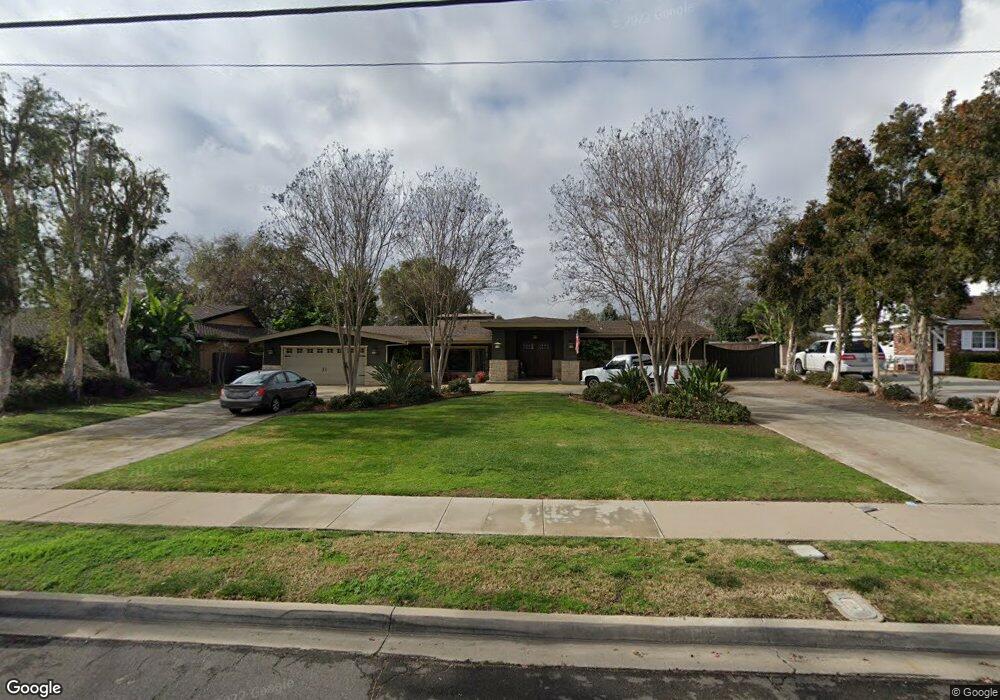
1042 Rippey St El Cajon, CA 92020
Fletcher Hills NeighborhoodEstimated Value: $1,071,000 - $1,591,785
4
Beds
4
Baths
3,951
Sq Ft
$309/Sq Ft
Est. Value
About This Home
This home is located at 1042 Rippey St, El Cajon, CA 92020 and is currently estimated at $1,220,196, approximately $308 per square foot. 1042 Rippey St is a home located in San Diego County with nearby schools including Fletcher Hills Elementary School, Parkway Academy, and West Hills High School.
Ownership History
Date
Name
Owned For
Owner Type
Purchase Details
Closed on
Mar 20, 2018
Sold by
Brown Robert Joe and Brown Julie C
Bought by
Brown Robert Joe and Brown Julie Chouinard
Current Estimated Value
Purchase Details
Closed on
Jan 8, 1999
Sold by
Nealon Kelly and Long Laurie
Bought by
Brown Robert Joe and Brown Julie C
Home Financials for this Owner
Home Financials are based on the most recent Mortgage that was taken out on this home.
Original Mortgage
$176,000
Outstanding Balance
$40,366
Interest Rate
6.63%
Estimated Equity
$1,179,830
Create a Home Valuation Report for This Property
The Home Valuation Report is an in-depth analysis detailing your home's value as well as a comparison with similar homes in the area
Home Values in the Area
Average Home Value in this Area
Purchase History
| Date | Buyer | Sale Price | Title Company |
|---|---|---|---|
| Brown Robert Joe | -- | Lawyers Title | |
| Brown Robert Joe | $320,000 | Commonwealth Land Title Co |
Source: Public Records
Mortgage History
| Date | Status | Borrower | Loan Amount |
|---|---|---|---|
| Open | Brown Robert Joe | $176,000 |
Source: Public Records
Tax History Compared to Growth
Tax History
| Year | Tax Paid | Tax Assessment Tax Assessment Total Assessment is a certain percentage of the fair market value that is determined by local assessors to be the total taxable value of land and additions on the property. | Land | Improvement |
|---|---|---|---|---|
| 2025 | $9,056 | $724,678 | $234,099 | $490,579 |
| 2024 | $9,056 | $710,469 | $229,509 | $480,960 |
| 2023 | $8,818 | $696,539 | $225,009 | $471,530 |
| 2022 | $9,018 | $682,883 | $220,598 | $462,285 |
| 2021 | $8,562 | $669,494 | $216,273 | $453,221 |
| 2020 | $8,111 | $662,630 | $214,056 | $448,574 |
| 2019 | $7,485 | $649,638 | $209,859 | $439,779 |
| 2018 | $7,329 | $636,901 | $205,745 | $431,156 |
| 2017 | $7,223 | $624,413 | $201,711 | $422,702 |
| 2016 | $6,986 | $612,170 | $197,756 | $414,414 |
| 2015 | $6,937 | $602,976 | $194,786 | $408,190 |
| 2014 | $6,796 | $591,166 | $190,971 | $400,195 |
Source: Public Records
Map
Nearby Homes
- 2524 Seattle Dr
- 2548 Katherine Ct
- 2052 Flying Hills Ln
- 700 Wakefield Ct
- 0 Hacienda Dr
- 2106 Windmill View Rd
- 1958 Milford Place
- 1677 Heron Ave
- 2527 Gibbons St
- 2213 Chatham St
- 8774 Tommy Dr
- 9254 Lake Murray Blvd Unit B
- 282 Garfield Ave
- 363 Garden Grove Ln
- 731 Dewane Dr
- 1951 Belmore Ct
- 1681 Hillsmont Dr
- 1673 Hillsmont Dr
- 9411 Lake Murray Blvd Unit B
- 1387 Weers St