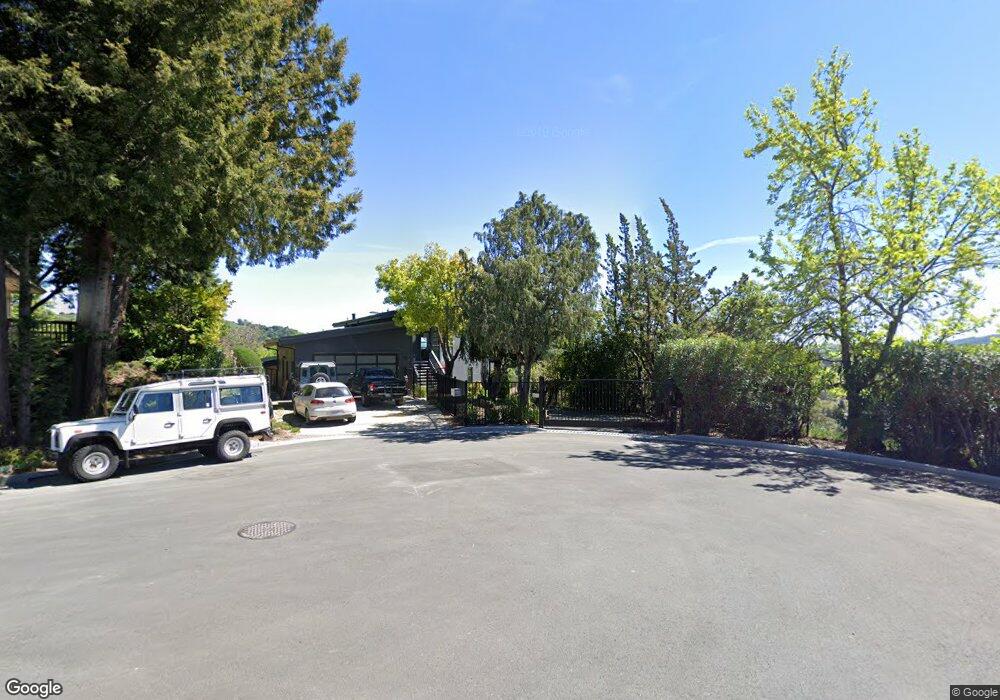
1042 Via Media Lafayette, CA 94549
Happy Valley NeighborhoodEstimated Value: $1,509,000 - $2,367,000
3
Beds
4
Baths
2,893
Sq Ft
$681/Sq Ft
Est. Value
About This Home
This home is located at 1042 Via Media, Lafayette, CA 94549 and is currently estimated at $1,969,682, approximately $680 per square foot. 1042 Via Media is a home located in Contra Costa County with nearby schools including Happy Valley Elementary School, M.H. Stanley Middle School, and Acalanes High School.
Ownership History
Date
Name
Owned For
Owner Type
Purchase Details
Closed on
Mar 30, 2012
Sold by
Citimortgage Inc
Bought by
Kemper Dan Daily and Kemper Flavia Andrea
Current Estimated Value
Home Financials for this Owner
Home Financials are based on the most recent Mortgage that was taken out on this home.
Original Mortgage
$735,165
Outstanding Balance
$511,128
Interest Rate
4.05%
Mortgage Type
New Conventional
Estimated Equity
$1,458,554
Purchase Details
Closed on
Dec 23, 2011
Sold by
Parker Gary
Bought by
Citimortgage Inc
Purchase Details
Closed on
May 25, 2005
Sold by
Stephan Rosalie
Bought by
Parker Gary
Home Financials for this Owner
Home Financials are based on the most recent Mortgage that was taken out on this home.
Original Mortgage
$888,800
Interest Rate
6.12%
Mortgage Type
Fannie Mae Freddie Mac
Purchase Details
Closed on
May 17, 1999
Sold by
Rosalie Stephan
Bought by
The Rosalie Stephan Trust
Create a Home Valuation Report for This Property
The Home Valuation Report is an in-depth analysis detailing your home's value as well as a comparison with similar homes in the area
Home Values in the Area
Average Home Value in this Area
Purchase History
| Date | Buyer | Sale Price | Title Company |
|---|---|---|---|
| Kemper Dan Daily | $865,000 | First American Title Insuran | |
| Citimortgage Inc | $849,900 | None Available | |
| Parker Gary | $1,111,000 | Chicago Title | |
| Stephan Rosalie | -- | First American Title | |
| The Rosalie Stephan Trust | -- | -- |
Source: Public Records
Mortgage History
| Date | Status | Borrower | Loan Amount |
|---|---|---|---|
| Open | Kemper Dan Daily | $735,165 | |
| Previous Owner | Parker Gary | $888,800 |
Source: Public Records
Tax History Compared to Growth
Tax History
| Year | Tax Paid | Tax Assessment Tax Assessment Total Assessment is a certain percentage of the fair market value that is determined by local assessors to be the total taxable value of land and additions on the property. | Land | Improvement |
|---|---|---|---|---|
| 2025 | $13,761 | $1,086,350 | $811,405 | $274,945 |
| 2024 | $13,518 | $1,065,050 | $795,496 | $269,554 |
| 2023 | $13,518 | $1,044,168 | $779,899 | $264,269 |
| 2022 | $13,311 | $1,023,695 | $764,607 | $259,088 |
| 2021 | $12,930 | $1,003,623 | $749,615 | $254,008 |
| 2019 | $12,531 | $973,857 | $727,382 | $246,475 |
| 2018 | $12,094 | $954,763 | $713,120 | $241,643 |
| 2017 | $11,890 | $936,043 | $699,138 | $236,905 |
| 2016 | $11,662 | $917,690 | $685,430 | $232,260 |
| 2015 | $11,346 | $903,907 | $675,135 | $228,772 |
| 2014 | $11,239 | $886,202 | $661,911 | $224,291 |
Source: Public Records
Map
Nearby Homes
- 3742 Mount Diablo Blvd Unit Woodhaven 2a
- 70 Woodbury Highlands Place Unit 24
- 70 Woodbury Highlands Place Unit 22
- 70 Woodbury Highlands Place Unit 30
- 70 Woodbury Highlands Place Unit 16
- 946 Risa Rd
- Diablo Terraces B1.1 Plan at Woodbury Highlands - Diablo Terraces
- Diablo Terraces B1 Plan at Woodbury Highlands - Diablo Terraces
- Diablo Terraces A1.1 Plan at Woodbury Highlands - Diablo Terraces
- Diablo Terraces A1 Plan at Woodbury Highlands - Diablo Terraces
- Highland Rows B1 Plan at Woodbury Highlands - Highland Rows
- Highland Rows B Plan at Woodbury Highlands - Highland Rows
- 1093 Via Roble
- Residence E302 Plan at The Brant
- Residence E215 Plan at The Brant
- Residence E313 Plan at The Brant
- Residence E210 Plan at The Brant
- Residence E111 Plan at The Brant
- Residence E312 Plan at The Brant
- Residence E212 Plan at The Brant