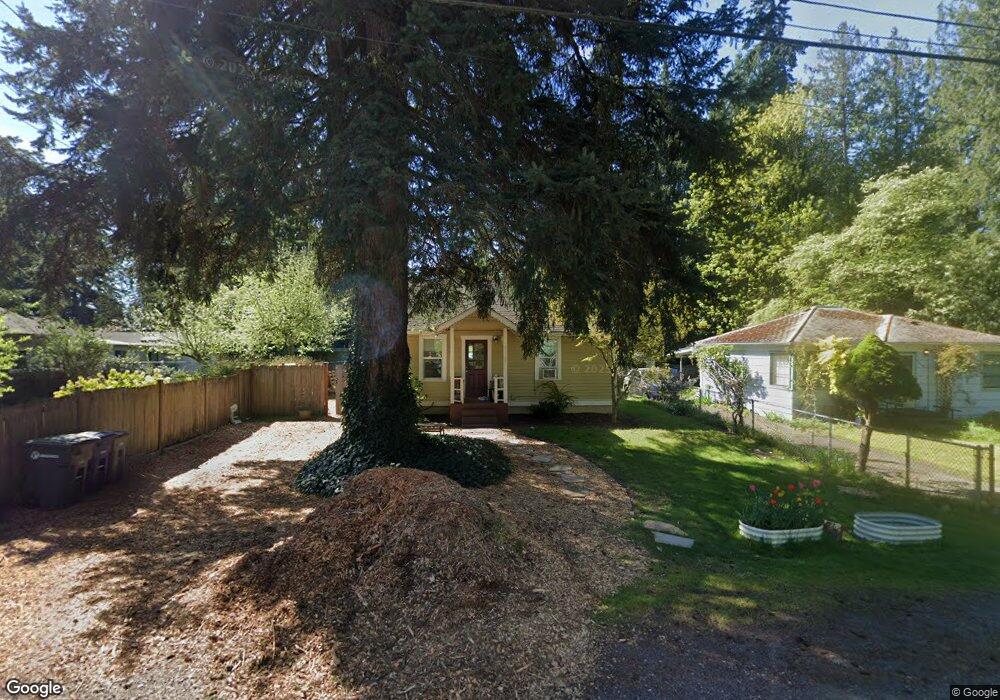
10425 NE 189th St Bothell, WA 98011
Downtown Bothell NeighborhoodEstimated Value: $588,000 - $628,000
1
Bed
1
Bath
590
Sq Ft
$1,039/Sq Ft
Est. Value
About This Home
This home is located at 10425 NE 189th St, Bothell, WA 98011 and is currently estimated at $613,085, approximately $1,039 per square foot. 10425 NE 189th St is a home located in King County with nearby schools including Maywood Hills Elementary School, Canyon Park Junior High School, and Bothell High School.
Ownership History
Date
Name
Owned For
Owner Type
Purchase Details
Closed on
Feb 4, 2022
Sold by
Tomczak Sara B
Bought by
Tomczak Douglas and Tomczak Sara B
Current Estimated Value
Home Financials for this Owner
Home Financials are based on the most recent Mortgage that was taken out on this home.
Original Mortgage
$300,000
Outstanding Balance
$242,107
Interest Rate
3.55%
Mortgage Type
New Conventional
Estimated Equity
$370,978
Purchase Details
Closed on
Oct 2, 2012
Sold by
Mcguire Lavelle F
Bought by
Best Sara M
Home Financials for this Owner
Home Financials are based on the most recent Mortgage that was taken out on this home.
Original Mortgage
$189,000
Interest Rate
3.63%
Mortgage Type
New Conventional
Purchase Details
Closed on
Jul 24, 1995
Sold by
Mcguire Don S and Mcguire Lavelle F
Bought by
Mcguire Don S and Mcguire Lavelle F
Purchase Details
Closed on
Oct 6, 1981
Sold by
Paone Anthony A and Paone Shawn S M
Bought by
Mcguire Don S and Mcguire Lavelle F
Create a Home Valuation Report for This Property
The Home Valuation Report is an in-depth analysis detailing your home's value as well as a comparison with similar homes in the area
Home Values in the Area
Average Home Value in this Area
Purchase History
| Date | Buyer | Sale Price | Title Company |
|---|---|---|---|
| Tomczak Douglas | $313 | Bc Law Firm Pa | |
| Best Sara M | $210,000 | First American | |
| Mcguire Don S | -- | -- | |
| Mcguire Don S | -- | Safeco Title Insurance Compa |
Source: Public Records
Mortgage History
| Date | Status | Borrower | Loan Amount |
|---|---|---|---|
| Open | Tomczak Douglas | $300,000 | |
| Previous Owner | Best Sara M | $189,000 |
Source: Public Records
Tax History
| Year | Tax Paid | Tax Assessment Tax Assessment Total Assessment is a certain percentage of the fair market value that is determined by local assessors to be the total taxable value of land and additions on the property. | Land | Improvement |
|---|---|---|---|---|
| 2024 | $5,036 | $520,000 | $519,000 | $1,000 |
| 2023 | $4,620 | $434,000 | $433,000 | $1,000 |
| 2022 | $4,145 | $515,000 | $377,000 | $138,000 |
| 2021 | $3,796 | $375,000 | $276,000 | $99,000 |
| 2020 | $3,307 | $316,000 | $230,000 | $86,000 |
| 2018 | $2,723 | $268,000 | $225,000 | $43,000 |
| 2017 | $2,470 | $230,000 | $193,000 | $37,000 |
| 2016 | $2,324 | $209,000 | $177,000 | $32,000 |
| 2015 | $2,051 | $200,000 | $171,000 | $29,000 |
| 2014 | -- | $170,000 | $150,000 | $20,000 |
| 2013 | -- | $191,000 | $160,000 | $31,000 |
Source: Public Records
Map
Nearby Homes
- 10335 NE 189th St
- 18607 104th Ave NE Unit B
- 18607 104th Ave NE Unit A
- 18604 105th Ave NE
- 18625 103rd Ave NE
- 18513 104th Ave NE Unit D(4)
- 18635 101st Ave NE Unit 6
- 18805 99th Ct NE Unit C
- 18805 99th Ct NE Unit D
- 18805 99th Ct NE Unit E
- 18814 99th Ct NE Unit B
- 18811 99th Ct NE Unit C
- 18913 99th Place NE Unit C
- 18809 99th Place NE Unit C
- 18809 99th Place NE Unit B
- 18933 99th Place NE Unit 1
- 19420 109th Ct NE
- 10535 NE 196th St
- 10035 NE 196th Place
- 10046 NE 196th Place
- 10419 NE 189th St
- 18717 105th Ave NE
- 18723 105th Ave NE
- 10422 NE 187th St
- 10430 NE 187th St
- 10436 NE 187th St
- 10420 NE 189th St
- 10414 NE 189th St
- 18716 104th Ave NE
- 10403 NE 189th St
- 10414 NE 187th St
- 10424 NE 189th St
- 10408 NE 189th St
- 18724 105th Ave NE
- 18706 104th Ave NE
- 10504 NE 187th St
- 10406 NE 189th St
- 10509 NE 189th St
- 10508 NE 189th St
- 10419 NE 190th St
Your Personal Tour Guide
Ask me questions while you tour the home.