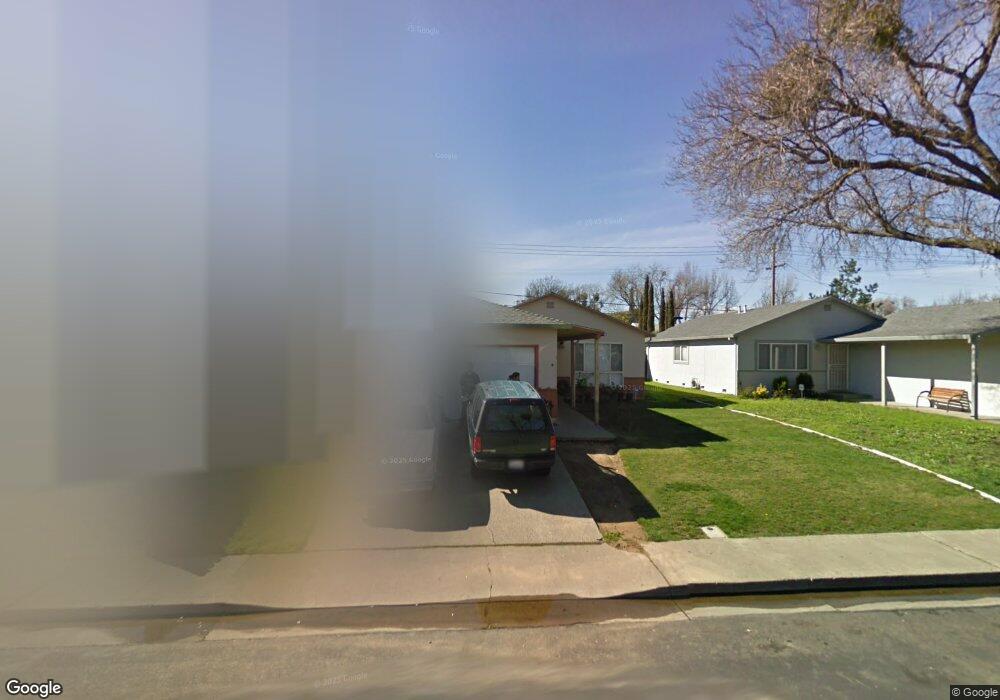
1043 Eisenhower St Fairfield, CA 94533
Estimated Value: $450,000 - $469,000
3
Beds
2
Baths
1,232
Sq Ft
$373/Sq Ft
Est. Value
About This Home
This home is located at 1043 Eisenhower St, Fairfield, CA 94533 and is currently estimated at $459,356, approximately $372 per square foot. 1043 Eisenhower St is a home located in Solano County with nearby schools including Anna Kyle Elementary School, Grange Middle School, and Armijo High School.
Ownership History
Date
Name
Owned For
Owner Type
Purchase Details
Closed on
Aug 13, 2001
Sold by
Nunez Feliznando
Bought by
Ruiz Rogelio and Ruiz Angelina
Current Estimated Value
Home Financials for this Owner
Home Financials are based on the most recent Mortgage that was taken out on this home.
Original Mortgage
$184,730
Outstanding Balance
$72,268
Interest Rate
7.19%
Mortgage Type
FHA
Estimated Equity
$387,088
Purchase Details
Closed on
Feb 25, 2000
Sold by
Wiseman Doyle K and Wiseman Roney
Bought by
Nunez Feliznando
Home Financials for this Owner
Home Financials are based on the most recent Mortgage that was taken out on this home.
Original Mortgage
$112,942
Interest Rate
8.16%
Purchase Details
Closed on
Oct 27, 1997
Sold by
Wiseman Lois
Bought by
Wiseman Lois M and The Wiseman Family Trust
Create a Home Valuation Report for This Property
The Home Valuation Report is an in-depth analysis detailing your home's value as well as a comparison with similar homes in the area
Home Values in the Area
Average Home Value in this Area
Purchase History
| Date | Buyer | Sale Price | Title Company |
|---|---|---|---|
| Ruiz Rogelio | -- | Fidelity National Title Co | |
| Nunez Feliznando | $129,500 | Fidelity National Title Co | |
| Wiseman Lois M | -- | -- |
Source: Public Records
Mortgage History
| Date | Status | Borrower | Loan Amount |
|---|---|---|---|
| Open | Ruiz Rogelio | $184,730 | |
| Previous Owner | Nunez Feliznando | $112,942 | |
| Closed | Nunez Feliznando | $20,000 | |
| Closed | Ruiz Rogelio | $9,000 |
Source: Public Records
Tax History
| Year | Tax Paid | Tax Assessment Tax Assessment Total Assessment is a certain percentage of the fair market value that is determined by local assessors to be the total taxable value of land and additions on the property. | Land | Improvement |
|---|---|---|---|---|
| 2025 | $3,151 | $288,063 | $73,856 | $214,207 |
| 2024 | $3,151 | $282,415 | $72,408 | $210,007 |
| 2023 | $3,053 | $276,879 | $70,989 | $205,890 |
| 2022 | $3,015 | $271,451 | $69,599 | $201,852 |
| 2021 | $2,984 | $266,130 | $68,235 | $197,895 |
| 2020 | $2,913 | $263,402 | $67,536 | $195,866 |
| 2019 | $2,840 | $258,238 | $66,212 | $192,026 |
| 2018 | $2,930 | $253,175 | $64,914 | $188,261 |
| 2017 | $2,793 | $248,212 | $63,642 | $184,570 |
| 2016 | $2,768 | $243,346 | $62,395 | $180,951 |
| 2015 | $2,454 | $228,000 | $55,000 | $173,000 |
| 2014 | $1,823 | $169,000 | $42,000 | $127,000 |
Source: Public Records
Map
Nearby Homes
- 518 Carolina St
- 1047 E Tennessee Ct
- 249 E Tennessee St
- 1318 Taft St
- 600 E Tennessee St
- 606 E Tennessee St
- 1541 Rayburn Ct
- 1424 Mckinley St
- 133 E Travis Blvd
- 117 Summertime Ln
- 1652 Glenmore Dr
- 1624 Dover Ave
- 1660 Glenmore Dr
- 1669 Rutledge Ln
- 338 Ridgecrest Cir
- 701 Shannon Dr
- 219 Wisconsin St
- 1124 Union Ave
- 424 San Marco St
- 1712 Arthur Ct
- 1037 Eisenhower St
- 1101 Eisenhower St
- 1031 Eisenhower St
- 1126 Taft St
- 1112 Taft St
- 501 Carolina St
- 1132 Taft St
- 1106 Taft St
- 1025 Eisenhower St
- 1113 Eisenhower St
- 500 Montana St
- 507 Carolina St
- 500 Carolina St
- 1138 Taft St
- 1100 Taft St
- 1019 Eisenhower St
- 1119 Eisenhower St
- 506 Montana St
- 506 Carolina St
Your Personal Tour Guide
Ask me questions while you tour the home.