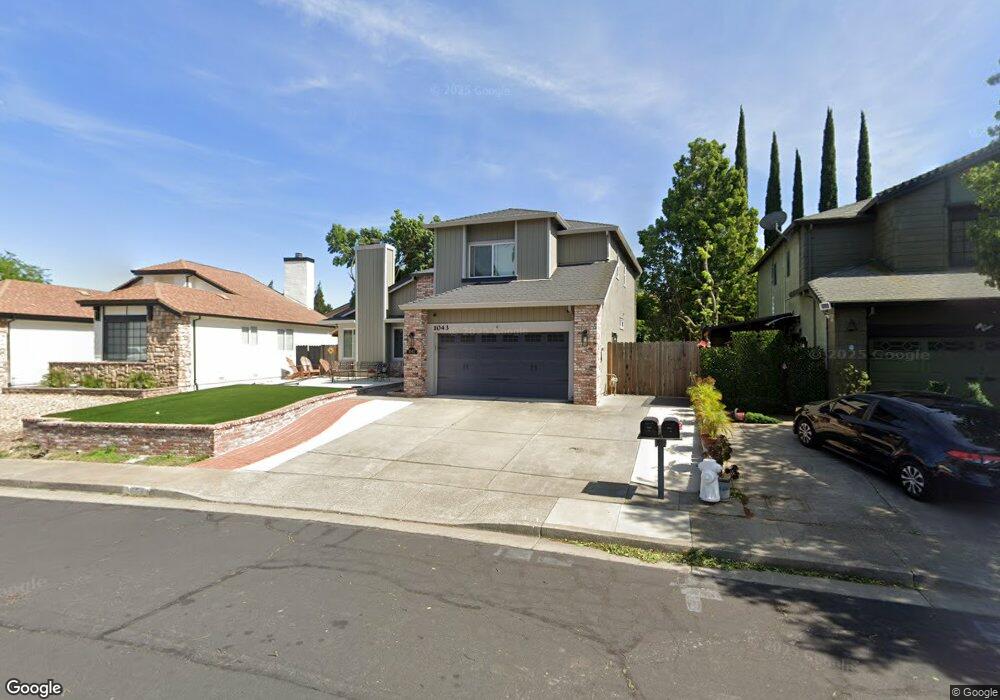
1043 Evergreen Ct Fairfield, CA 94533
Estimated Value: $549,283 - $603,000
4
Beds
3
Baths
1,912
Sq Ft
$302/Sq Ft
Est. Value
About This Home
This home is located at 1043 Evergreen Ct, Fairfield, CA 94533 and is currently estimated at $576,821, approximately $301 per square foot. 1043 Evergreen Ct is a home located in Solano County with nearby schools including Laurel Creek Elementary School, Grange Middle School, and Fairfield High School.
Ownership History
Date
Name
Owned For
Owner Type
Purchase Details
Closed on
Apr 30, 2008
Sold by
Indymac Bank Fsb
Bought by
Marsh Jesze J
Current Estimated Value
Home Financials for this Owner
Home Financials are based on the most recent Mortgage that was taken out on this home.
Original Mortgage
$281,030
Interest Rate
6.04%
Mortgage Type
FHA
Purchase Details
Closed on
Dec 19, 2007
Sold by
Dorsey Michael
Bought by
Indymac Bank Fsb
Purchase Details
Closed on
May 22, 2007
Sold by
Dorsey Michael
Bought by
Caa International Inc
Purchase Details
Closed on
Aug 1, 2006
Sold by
Dorsey Dawn
Bought by
Dorsey Michael
Home Financials for this Owner
Home Financials are based on the most recent Mortgage that was taken out on this home.
Original Mortgage
$412,500
Interest Rate
1%
Mortgage Type
Negative Amortization
Purchase Details
Closed on
Jul 7, 2005
Sold by
Dorsey Michael D
Bought by
Dorsey Michael and Dorsey Dawn
Home Financials for this Owner
Home Financials are based on the most recent Mortgage that was taken out on this home.
Original Mortgage
$407,000
Interest Rate
6.52%
Mortgage Type
New Conventional
Purchase Details
Closed on
Jul 8, 2004
Sold by
Hutchinson Steven R and Hutchinson Mariella D
Bought by
Dorsey Michael D
Home Financials for this Owner
Home Financials are based on the most recent Mortgage that was taken out on this home.
Original Mortgage
$338,000
Interest Rate
7.65%
Mortgage Type
Purchase Money Mortgage
Purchase Details
Closed on
Oct 3, 2000
Sold by
Hutchinson Steven R D and Mezzina Marie
Bought by
Hutchinson Steven R and Hutchinson Mariella D
Home Financials for this Owner
Home Financials are based on the most recent Mortgage that was taken out on this home.
Original Mortgage
$37,500
Interest Rate
8.01%
Mortgage Type
Credit Line Revolving
Purchase Details
Closed on
Jul 28, 1999
Sold by
Aviles Glenda C
Bought by
Hutchinson Steven R and Mezzina Mariella D
Home Financials for this Owner
Home Financials are based on the most recent Mortgage that was taken out on this home.
Original Mortgage
$181,950
Interest Rate
7.5%
Purchase Details
Closed on
Jul 27, 1999
Sold by
Hague Matthew
Bought by
Aviles Glenda C
Home Financials for this Owner
Home Financials are based on the most recent Mortgage that was taken out on this home.
Original Mortgage
$181,950
Interest Rate
7.5%
Purchase Details
Closed on
Sep 2, 1998
Sold by
Hague Matthew G
Bought by
Aviles Hague Glenda
Create a Home Valuation Report for This Property
The Home Valuation Report is an in-depth analysis detailing your home's value as well as a comparison with similar homes in the area
Home Values in the Area
Average Home Value in this Area
Purchase History
| Date | Buyer | Sale Price | Title Company |
|---|---|---|---|
| Marsh Jesze J | $285,000 | Lsi Title Company | |
| Indymac Bank Fsb | $407,250 | None Available | |
| Caa International Inc | -- | None Available | |
| Dorsey Michael | -- | Chicago Title Co | |
| Dorsey Michael | -- | Alliance Title Co | |
| Dorsey Michael D | $422,500 | Fidelity Title Co | |
| Hutchinson Steven R | -- | North American Title Co | |
| Hutchinson Steven R | $203,000 | Placer Title Company | |
| Aviles Glenda C | -- | -- | |
| Aviles Hague Glenda | -- | Placer Title Company |
Source: Public Records
Mortgage History
| Date | Status | Borrower | Loan Amount |
|---|---|---|---|
| Previous Owner | Marsh Jesze J | $281,030 | |
| Previous Owner | Dorsey Michael | $412,500 | |
| Previous Owner | Dorsey Michael | $407,000 | |
| Previous Owner | Dorsey Michael D | $338,000 | |
| Previous Owner | Hutchinson Steven R | $37,500 | |
| Previous Owner | Hutchinson Steven R | $181,950 |
Source: Public Records
Tax History
| Year | Tax Paid | Tax Assessment Tax Assessment Total Assessment is a certain percentage of the fair market value that is determined by local assessors to be the total taxable value of land and additions on the property. | Land | Improvement |
|---|---|---|---|---|
| 2025 | $4,189 | $374,343 | $124,779 | $249,564 |
| 2024 | $4,189 | $367,004 | $122,333 | $244,671 |
| 2023 | $4,060 | $359,809 | $119,935 | $239,874 |
| 2022 | $4,011 | $352,755 | $117,584 | $235,171 |
| 2021 | $3,971 | $345,839 | $115,279 | $230,560 |
| 2020 | $3,878 | $342,293 | $114,097 | $228,196 |
| 2019 | $3,783 | $335,582 | $111,860 | $223,722 |
| 2018 | $3,905 | $329,003 | $109,667 | $219,336 |
| 2017 | $3,725 | $322,553 | $107,517 | $215,036 |
| 2016 | $3,696 | $316,229 | $105,409 | $210,820 |
| 2015 | $3,450 | $311,480 | $103,826 | $207,654 |
| 2014 | $3,392 | $303,000 | $97,000 | $206,000 |
Source: Public Records
Map
Nearby Homes
- 2913 Balsam Ct
- 1121 Willow Ln
- 1031 Suffolk Way
- 2924 Redwood Dr
- 2913 Willow Ct
- 989 Suffolk Way
- 1175 Hickory Ave
- 782 Ash Ct
- 2856 Rebecca Dr
- 772 Largo Ct
- 2532 Beaufort Ct
- 3826 Danbury Way
- 2429 Baltic Dr
- 3280 Mustang Cir
- 724 E Atlantic Ave
- 1401 Spur Ln
- 2386 Baltic Ct
- 738 Marsh Place
- 2450 Oceanic Dr
- 1328 Horizon Cir
- 1035 Evergreen Ct
- 1051 Evergreen Ct
- 3051 Gulf Dr
- 3043 Gulf Dr
- 1027 Evergreen Ct
- 1059 Evergreen Ct
- 3059 Gulf Dr
- 3035 Gulf Dr
- 1032 Evergreen Ct
- 1024 Evergreen Ct
- 3067 Gulf Dr
- 1019 Evergreen Ct
- 1040 Evergreen Ct
- 1067 Evergreen Ct
- 3027 Gulf Dr
- 1016 Evergreen Ct
- 3075 Gulf Dr
- 1048 Evergreen Ct
- 1011 Evergreen Ct
- 1008 Evergreen Ct
Your Personal Tour Guide
Ask me questions while you tour the home.