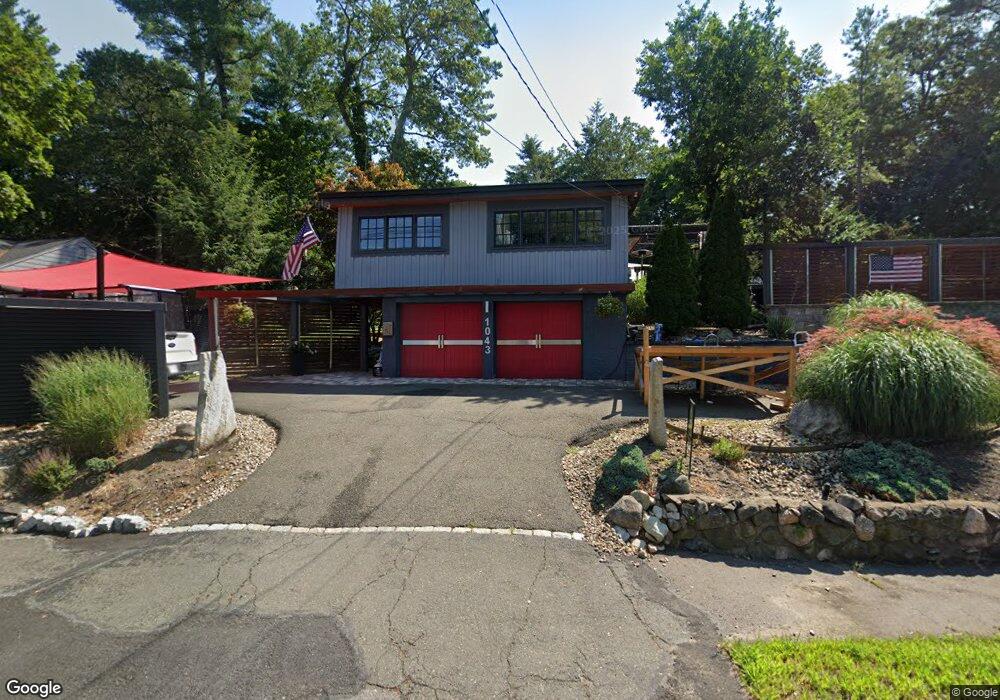
1043 Main St Lynnfield, MA 01940
Estimated Value: $842,679 - $893,000
3
Beds
2
Baths
1,611
Sq Ft
$543/Sq Ft
Est. Value
About This Home
This home is located at 1043 Main St, Lynnfield, MA 01940 and is currently estimated at $875,420, approximately $543 per square foot. 1043 Main St is a home located in Essex County with nearby schools including Lynnfield Middle School, Lynnfield High School, and Covenant Christian Academy.
Ownership History
Date
Name
Owned For
Owner Type
Purchase Details
Closed on
Sep 3, 2014
Sold by
Butler Martin
Bought by
Gallo John
Current Estimated Value
Purchase Details
Closed on
Jul 15, 2009
Sold by
Todisco Stephen
Bought by
Butler Martin
Home Financials for this Owner
Home Financials are based on the most recent Mortgage that was taken out on this home.
Original Mortgage
$100,000
Interest Rate
5.31%
Mortgage Type
Purchase Money Mortgage
Purchase Details
Closed on
Oct 6, 1987
Sold by
Corrigan Paul
Bought by
Todisco Stephen
Create a Home Valuation Report for This Property
The Home Valuation Report is an in-depth analysis detailing your home's value as well as a comparison with similar homes in the area
Home Values in the Area
Average Home Value in this Area
Purchase History
| Date | Buyer | Sale Price | Title Company |
|---|---|---|---|
| Gallo John | -- | -- | |
| Butler Martin | $412,000 | -- | |
| Todisco Stephen | $180,000 | -- |
Source: Public Records
Mortgage History
| Date | Status | Borrower | Loan Amount |
|---|---|---|---|
| Previous Owner | Todisco Stephen | $100,000 | |
| Previous Owner | Todisco Stephen | $40,000 |
Source: Public Records
Tax History
| Year | Tax Paid | Tax Assessment Tax Assessment Total Assessment is a certain percentage of the fair market value that is determined by local assessors to be the total taxable value of land and additions on the property. | Land | Improvement |
|---|---|---|---|---|
| 2025 | $7,878 | $746,000 | $499,700 | $246,300 |
| 2024 | $7,725 | $735,000 | $492,300 | $242,700 |
| 2023 | $7,318 | $647,600 | $423,700 | $223,900 |
| 2022 | $7,105 | $592,600 | $401,900 | $190,700 |
| 2021 | $6,858 | $516,800 | $334,900 | $181,900 |
| 2020 | $6,487 | $466,000 | $284,000 | $182,000 |
| 2019 | $6,258 | $449,900 | $267,900 | $182,000 |
| 2018 | $6,070 | $441,100 | $267,900 | $173,200 |
| 2017 | $5,848 | $424,400 | $251,200 | $173,200 |
| 2016 | $5,929 | $408,900 | $246,200 | $162,700 |
| 2015 | $5,813 | $401,200 | $245,500 | $155,700 |
Source: Public Records
Map
Nearby Homes
- 4 Lowell St
- 6 Ashley Ct
- 15 Fairway Ln Unit 55
- 19 Fairway Ln Unit 53
- 5 Stableford Ct Unit 11
- 9 Stableford Ct Unit 9
- 35 Catherine Dr
- 35 Lincoln Ave
- 8 Temi Rd
- 6 Glen Dr
- 1466 Main St
- 11 Hutchins Cir
- 7 Pinewood Rd
- 2 Bridle Path
- 23 Hamilton Rd
- 24 Worcester Rd
- 2 Sachem Rd
- 11 Elizabeth Way
- 12 Heritage Ln
- 27 Park St
Your Personal Tour Guide
Ask me questions while you tour the home.