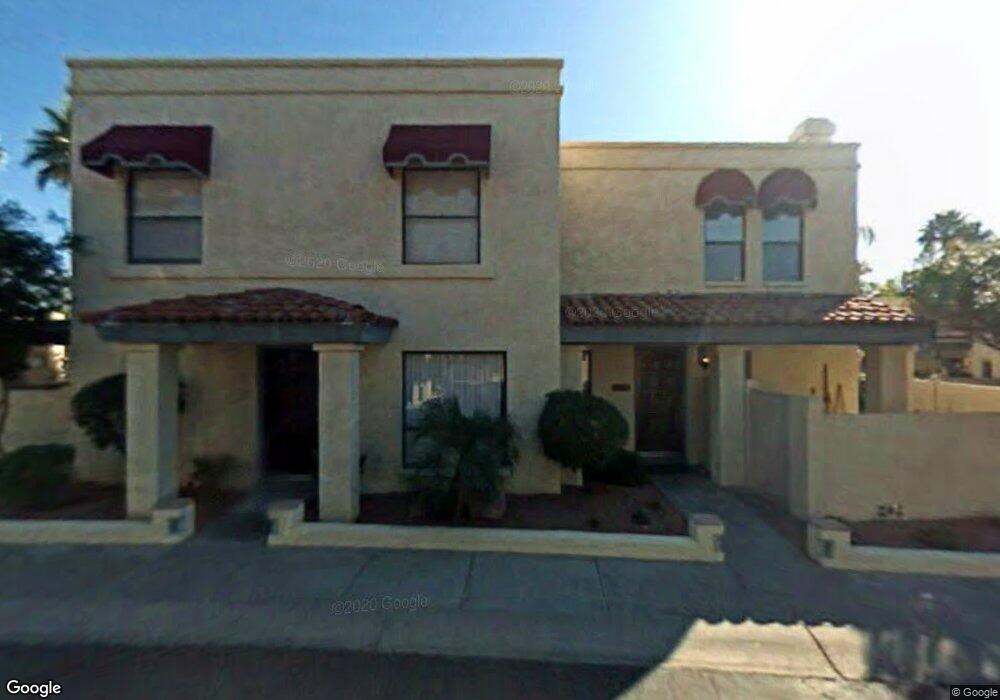
10431 N 11th St Unit 1 Phoenix, AZ 85020
North Mountain Village NeighborhoodEstimated Value: $260,621 - $298,000
2
Beds
2
Baths
976
Sq Ft
$295/Sq Ft
Est. Value
About This Home
This home is located at 10431 N 11th St Unit 1, Phoenix, AZ 85020 and is currently estimated at $287,655, approximately $294 per square foot. 10431 N 11th St Unit 1 is a home located in Maricopa County with nearby schools including Sunnyslope Elementary School, Sunnyslope High School, and Montessori Day Public Schools Chartered - Mountainside.
Ownership History
Date
Name
Owned For
Owner Type
Purchase Details
Closed on
Sep 25, 2015
Sold by
Jaycox Annette
Bought by
Jaycox Annette
Current Estimated Value
Home Financials for this Owner
Home Financials are based on the most recent Mortgage that was taken out on this home.
Original Mortgage
$127,000
Outstanding Balance
$99,441
Interest Rate
3.9%
Mortgage Type
New Conventional
Estimated Equity
$188,214
Purchase Details
Closed on
Jun 27, 2002
Sold by
Jaycox John
Bought by
Jaycox Annette
Purchase Details
Closed on
Jun 20, 2002
Sold by
Calkins F Thomas W and Hunt Pete S
Bought by
Jaycox Annette
Purchase Details
Closed on
Apr 1, 1997
Sold by
Hunt Pete S
Bought by
Calkins F Thomas W and Hunt Pete S
Purchase Details
Closed on
Apr 10, 1996
Sold by
Updike Geri L
Bought by
Hunt Pete S
Home Financials for this Owner
Home Financials are based on the most recent Mortgage that was taken out on this home.
Original Mortgage
$45,900
Interest Rate
7.68%
Mortgage Type
New Conventional
Create a Home Valuation Report for This Property
The Home Valuation Report is an in-depth analysis detailing your home's value as well as a comparison with similar homes in the area
Home Values in the Area
Average Home Value in this Area
Purchase History
| Date | Buyer | Sale Price | Title Company |
|---|---|---|---|
| Jaycox Annette | -- | First American Title Company | |
| Jaycox Annette | -- | Transnation Title Insurance | |
| Jaycox Annette | $106,000 | Transnation Title Insurance | |
| Calkins F Thomas W | -- | -- | |
| Hunt Pete S | $75,900 | Chicago Title Insurance Co |
Source: Public Records
Mortgage History
| Date | Status | Borrower | Loan Amount |
|---|---|---|---|
| Open | Jaycox Annette | $127,000 | |
| Previous Owner | Hunt Pete S | $45,900 |
Source: Public Records
Tax History Compared to Growth
Tax History
| Year | Tax Paid | Tax Assessment Tax Assessment Total Assessment is a certain percentage of the fair market value that is determined by local assessors to be the total taxable value of land and additions on the property. | Land | Improvement |
|---|---|---|---|---|
| 2025 | $1,064 | $8,372 | -- | -- |
| 2024 | $1,005 | $7,973 | -- | -- |
| 2023 | $1,005 | $21,220 | $4,240 | $16,980 |
| 2022 | $973 | $15,420 | $3,080 | $12,340 |
| 2021 | $985 | $14,930 | $2,980 | $11,950 |
| 2020 | $961 | $13,380 | $2,670 | $10,710 |
| 2019 | $943 | $12,010 | $2,400 | $9,610 |
| 2018 | $918 | $10,550 | $2,110 | $8,440 |
| 2017 | $914 | $8,820 | $1,760 | $7,060 |
| 2016 | $791 | $7,760 | $1,550 | $6,210 |
| 2015 | $734 | $6,970 | $1,390 | $5,580 |
Source: Public Records
Map
Nearby Homes
- 10606 N 11th St
- 10445 N 11th Place Unit 3
- 10420 N 11th St Unit 3
- 1010 E Lois Ln
- 10408 N 11th St Unit 2
- 1101 E North Ln Unit 3
- 10409 N 10th St Unit 1
- 10420 N 10th St Unit 2
- 10414 N 10th St Unit 1
- 10655 N 9th St Unit 205
- 10655 N 9th St Unit 135
- 1230 E Peoria Ave
- 1172 E Cochise Dr
- 10256 N 12th Place Unit 2
- 1219 E Christy Dr
- 1173 E Cochise Dr
- 10410 N Cave Creek Rd Unit 2119
- 10410 N Cave Creek Rd Unit 1230
- 10410 N Cave Creek Rd Unit 1032
- 10410 N Cave Creek Rd Unit 2114
- 10431 N 11th St Unit 3
- 10431 N 11th St Unit 2
- 10427 N 11th St Unit 3
- 10427 N 11th St Unit 1
- 10427 N 11th St
- 10427 N 11th St
- 10427 N 11th St
- 10425 N 11th St Unit 2
- 10425 N 11th St Unit 1
- 10425 N 11th St Unit 3
- 10437 N 11th St Unit 2
- 10437 N 11th St Unit 1
- 10437 N 11th St Unit 3
- 10432 N 11th St Unit 3
- 10432 N 11th St Unit 1
- 10432 N 11th St Unit 2
- 10426 N 11th St
- 10426 N 11th St Unit 1
- 10421 N 11th St Unit 3
- 10421 N 11th St Unit 1