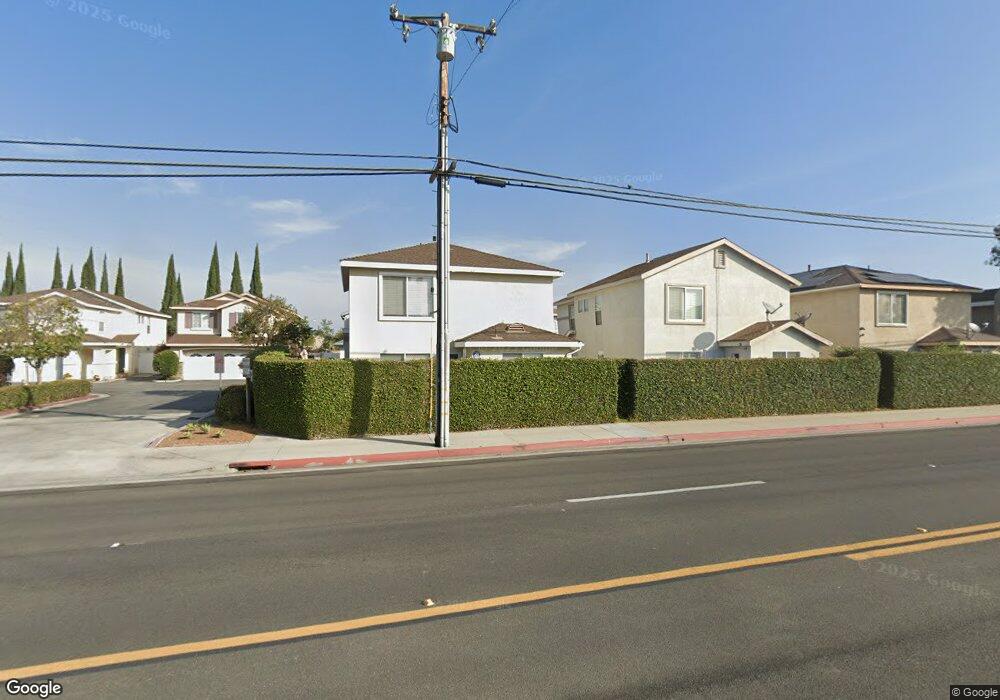
10431 Queens Way Stanton, CA 90680
West Anaheim NeighborhoodEstimated Value: $643,256 - $703,000
3
Beds
2
Baths
1,163
Sq Ft
$576/Sq Ft
Est. Value
About This Home
This home is located at 10431 Queens Way, Stanton, CA 90680 and is currently estimated at $669,814, approximately $575 per square foot. 10431 Queens Way is a home located in Orange County with nearby schools including Hansen Elementary School, Orangeview Junior High, and Western High School.
Ownership History
Date
Name
Owned For
Owner Type
Purchase Details
Closed on
Oct 31, 2002
Sold by
Gutierrez Mario A and Gutierrez Gilma
Bought by
Gutierrez Mario Antonio and Gutierrez Gilma
Current Estimated Value
Purchase Details
Closed on
Aug 7, 1997
Sold by
Gutierrez Gilma
Bought by
Gutierrez Mario A and Gutierrez Gilma
Purchase Details
Closed on
Jun 10, 1996
Sold by
Maldonado Carlos H
Bought by
Gutierrez Gilma
Purchase Details
Closed on
May 25, 1995
Sold by
Hud
Bought by
Maldonado Carlos H
Home Financials for this Owner
Home Financials are based on the most recent Mortgage that was taken out on this home.
Original Mortgage
$81,600
Interest Rate
8.37%
Mortgage Type
FHA
Purchase Details
Closed on
Jan 18, 1995
Sold by
Key Corp Mtg Inc
Bought by
Hud
Purchase Details
Closed on
Dec 29, 1994
Sold by
Keycorp Mtg Inc
Bought by
Keycorp Mtg Inc
Create a Home Valuation Report for This Property
The Home Valuation Report is an in-depth analysis detailing your home's value as well as a comparison with similar homes in the area
Home Values in the Area
Average Home Value in this Area
Purchase History
| Date | Buyer | Sale Price | Title Company |
|---|---|---|---|
| Gutierrez Mario Antonio | -- | -- | |
| Gutierrez Mario A | -- | California Counties Title Co | |
| Gutierrez Gilma | -- | -- | |
| Maldonado Carlos H | $85,000 | California Counties Title Co | |
| Hud | -- | Benefit Land Title | |
| Keycorp Mtg Inc | $152,460 | Benefit Land Title Co |
Source: Public Records
Mortgage History
| Date | Status | Borrower | Loan Amount |
|---|---|---|---|
| Closed | Maldonado Carlos H | $81,600 |
Source: Public Records
Tax History
| Year | Tax Paid | Tax Assessment Tax Assessment Total Assessment is a certain percentage of the fair market value that is determined by local assessors to be the total taxable value of land and additions on the property. | Land | Improvement |
|---|---|---|---|---|
| 2025 | $2,123 | $148,193 | $51,787 | $96,406 |
| 2024 | $2,123 | $145,288 | $50,772 | $94,516 |
| 2023 | $2,070 | $142,440 | $49,777 | $92,663 |
| 2022 | $2,028 | $139,648 | $48,801 | $90,847 |
| 2021 | $2,042 | $136,910 | $47,844 | $89,066 |
| 2020 | $2,013 | $135,507 | $47,354 | $88,153 |
| 2019 | $1,966 | $132,850 | $46,425 | $86,425 |
| 2018 | $1,938 | $130,246 | $45,515 | $84,731 |
| 2017 | $1,878 | $127,693 | $44,623 | $83,070 |
| 2016 | $1,869 | $125,190 | $43,748 | $81,442 |
| 2015 | $1,847 | $123,310 | $43,091 | $80,219 |
| 2014 | $1,766 | $120,895 | $42,247 | $78,648 |
Source: Public Records
Map
Nearby Homes
- 10335 W Briar Oaks Dr Unit A
- 10345 W Briar Oaks Dr Unit E
- 10450 E Briar Oaks Dr Unit B
- 10526 Carrotwood Way
- 10271 Garrett Rd
- 10532 Royal Oak Way
- 7401 Grandoaks Dr
- 7915 Cerritos Ave Unit 27
- 7912 2nd St Unit 4
- 10550 Western Ave Unit 3
- 10550 Western Ave Unit 86
- 10550 Western Ave Unit 33
- 10550 Western Ave Unit 128
- 10550 Western Ave Unit 13
- 10550 Western Ave Unit 29
- 3050 W Ball Rd Unit 88
- 3050 W Ball Rd Unit 175
- 3050 W Ball Rd
- 3050 W Ball Rd Unit 58
- 3050 W Ball Rd Unit 132
- 7650 College Dr
- 10441 Queens Way
- 10430 Rutgers Way
- 7640 College Dr
- 10440 Rutgers Way
- 10430 Queens Way
- 10420 Queens Way
- 10440 Queens Way
- 10431 College Dr
- 7647 Nancy Ln
- 7645 Nancy Ln
- 10431 Rutgers Way
- 10421 College Dr
- 7630 College Dr
- 10441 Rutgers Way
- 7651 College Dr
- 7643 Nancy Ln
- 7641 College Dr
- 10451 College Dr
- 7671 Hunter Way
Your Personal Tour Guide
Ask me questions while you tour the home.