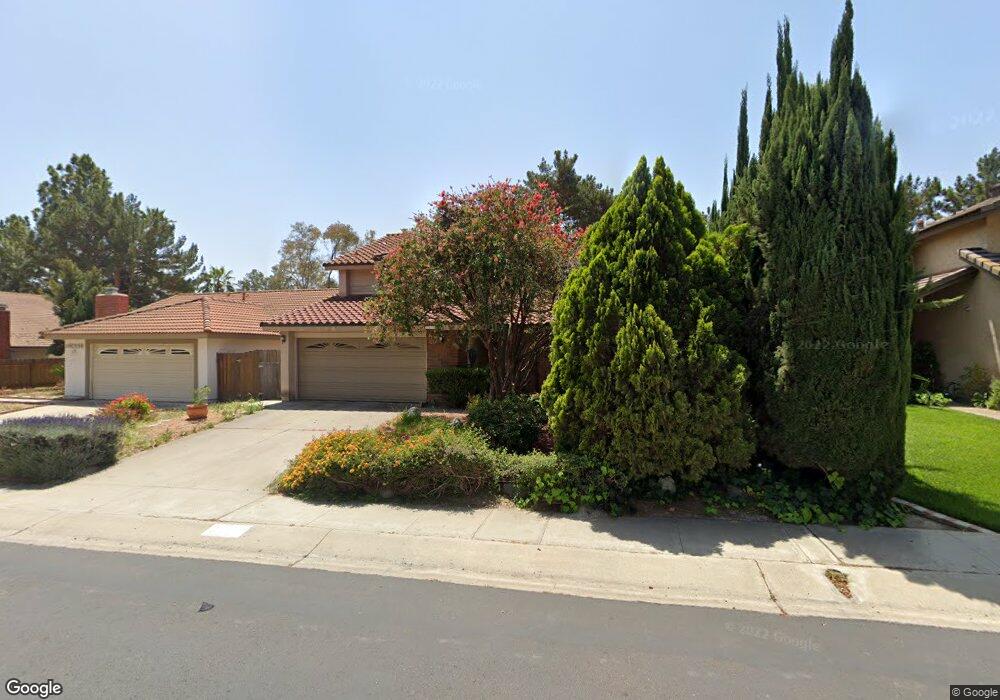
10435 Pine Grove St Spring Valley, CA 91978
Estimated Value: $810,440 - $851,000
3
Beds
3
Baths
2,011
Sq Ft
$415/Sq Ft
Est. Value
About This Home
This home is located at 10435 Pine Grove St, Spring Valley, CA 91978 and is currently estimated at $834,860, approximately $415 per square foot. 10435 Pine Grove St is a home located in San Diego County with nearby schools including Loma Elementary School, Spring Valley Middle School, and Monte Vista High School.
Ownership History
Date
Name
Owned For
Owner Type
Purchase Details
Closed on
Feb 5, 2003
Sold by
Fleener Grant M and Fleener Carlotta H
Bought by
Fleener Grant M and Fleener Carlotta H
Current Estimated Value
Purchase Details
Closed on
Jul 7, 1989
Create a Home Valuation Report for This Property
The Home Valuation Report is an in-depth analysis detailing your home's value as well as a comparison with similar homes in the area
Home Values in the Area
Average Home Value in this Area
Purchase History
| Date | Buyer | Sale Price | Title Company |
|---|---|---|---|
| Fleener Grant M | -- | -- | |
| -- | $175,000 | -- |
Source: Public Records
Tax History
| Year | Tax Paid | Tax Assessment Tax Assessment Total Assessment is a certain percentage of the fair market value that is determined by local assessors to be the total taxable value of land and additions on the property. | Land | Improvement |
|---|---|---|---|---|
| 2025 | $4,322 | $321,922 | $123,414 | $198,508 |
| 2024 | $4,322 | $315,611 | $120,995 | $194,616 |
| 2023 | $4,183 | $309,423 | $118,623 | $190,800 |
| 2022 | $4,110 | $303,357 | $116,298 | $187,059 |
| 2021 | $4,070 | $297,410 | $114,018 | $183,392 |
| 2020 | $3,906 | $294,361 | $112,849 | $181,512 |
| 2019 | $3,846 | $288,590 | $110,637 | $177,953 |
| 2018 | $3,726 | $282,932 | $108,468 | $174,464 |
| 2017 | $3,632 | $277,386 | $106,342 | $171,044 |
| 2016 | $3,496 | $271,948 | $104,257 | $167,691 |
| 2015 | $3,466 | $267,864 | $102,691 | $165,173 |
| 2014 | $3,404 | $262,618 | $100,680 | $161,938 |
Source: Public Records
Map
Nearby Homes
- 10527 Moorpark St
- 3065 Charwood Ct
- 3067 Charwood Ct
- 3037 Chipwood Ct
- 10770 Jamacha Blvd Unit 104
- 10770 Jamacha Blvd Unit 74
- 10702 Ensworth Way
- 2910 Elm Tree Ct
- 2930 Anawood Way
- 2946 Alanwood Ct
- 2962 Alanwood Ct
- 10865 Charing Cross Rd
- 10707 Jamacha Blvd Unit 24
- 10707 Jamacha Blvd Unit SPC 233
- 10707 Jamacha Blvd Unit 72
- 10707 Jamacha Blvd Unit 161
- 10620 Garden Way
- 3331 Eton Greens Ct
- 10767 Jamacha Blvd Unit SPC 119
- 10767 Jamacha Blvd Unit SPC 62
- 10447 Pine Grove St
- 10429 Pine Grove St
- 10417 Pine Grove St
- 10457 Pine Grove St
- 10411 Pine Grove St
- 10467 Pine Grove St
- 10405 Pine Grove St
- 10471 Pine Grove St
- 10369 Pine Grove St
- 10359 Pine Grove St
- 10485 Pine Grove St
- 10353 Pine Grove St
- 2912 Pine Grove Ct
- 2924 Pine Grove Ct
- 10452 Moorpark St
- 10438 Moorpark St
- 10462 Moorpark St
- 10430 Moorpark St
- 10347 Pine Grove St
- 10491 Pine Grove St
Your Personal Tour Guide
Ask me questions while you tour the home.