Estimated Value: $552,000 - $608,552
3
Beds
4
Baths
2,178
Sq Ft
$267/Sq Ft
Est. Value
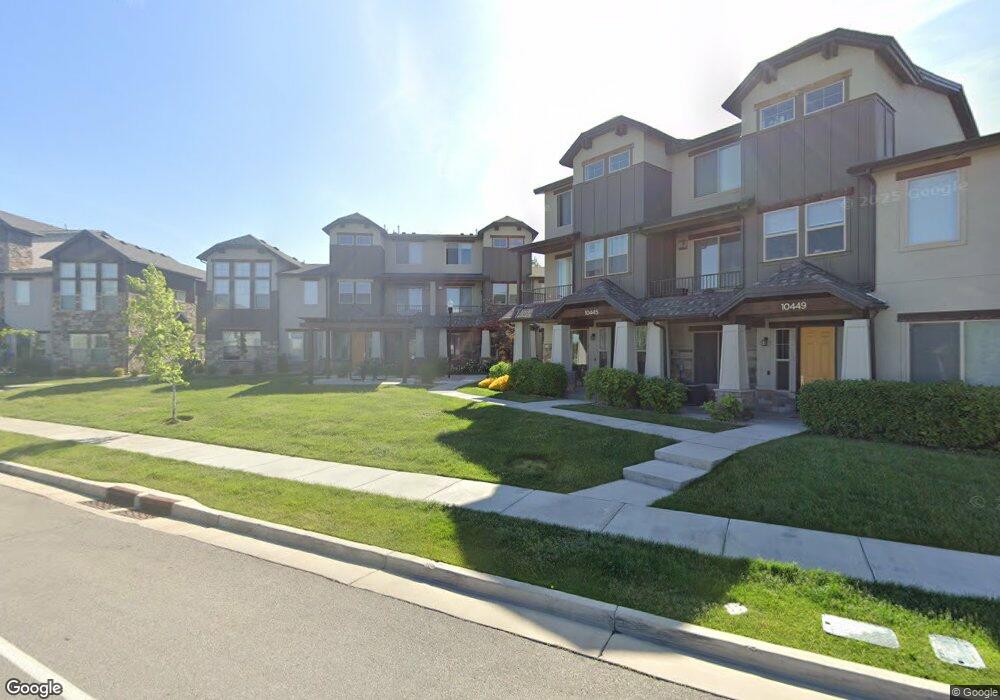
About This Home
Amazing townhome in great Sandy location! Gorgeous views of the mountains throughout. Commuter friendly community with close proximity to I-15 and Trax. Close to the Shops at South Towne, Little Cottonwood Canyon and plenty of restaurants.
All three bedrooms have their own private bathroom with two true masters.
Quartz Countertops
GE Gourmet Kitchen Appliances
Gas Range
Fireplace
Washer and Dryer
2 car garage
Wood floors
Walk In Closet
Balcony
Ownership History
Date
Name
Owned For
Owner Type
Purchase Details
Closed on
Aug 12, 2019
Sold by
Sandy Home Development Llc
Bought by
Timothy Auri and Timothy Lorren
Current Estimated Value
Home Financials for this Owner
Home Financials are based on the most recent Mortgage that was taken out on this home.
Original Mortgage
$222,275
Outstanding Balance
$193,948
Interest Rate
3.73%
Mortgage Type
New Conventional
Estimated Equity
$388,440
Create a Home Valuation Report for This Property
The Home Valuation Report is an in-depth analysis detailing your home's value as well as a comparison with similar homes in the area
Home Values in the Area
Average Home Value in this Area
Purchase History
| Date | Buyer | Sale Price | Title Company |
|---|---|---|---|
| Timothy Auri | -- | Old Republic Ttl Draper Orem |
Source: Public Records
Mortgage History
| Date | Status | Borrower | Loan Amount |
|---|---|---|---|
| Open | Timothy Auri | $222,275 |
Source: Public Records
Property History
| Date | Event | Price | List to Sale | Price per Sq Ft |
|---|---|---|---|---|
| 02/07/2026 02/07/26 | Off Market | $2,500 | -- | -- |
| 01/05/2026 01/05/26 | Price Changed | $2,500 | -3.8% | $1 / Sq Ft |
| 12/10/2025 12/10/25 | Price Changed | $2,600 | -3.7% | $1 / Sq Ft |
| 12/01/2025 12/01/25 | For Rent | $2,700 | 0.0% | -- |
| 11/29/2025 11/29/25 | Off Market | $2,700 | -- | -- |
| 10/21/2025 10/21/25 | For Rent | $2,700 | 0.0% | -- |
| 10/28/2024 10/28/24 | Off Market | $2,700 | -- | -- |
| 10/08/2024 10/08/24 | Off Market | $2,700 | -- | -- |
| 10/06/2024 10/06/24 | For Rent | $2,700 | 0.0% | -- |
| 10/06/2024 10/06/24 | For Rent | $2,700 | 0.0% | -- |
| 09/01/2024 09/01/24 | For Rent | $2,700 | -- | -- |
Tax History
| Year | Tax Paid | Tax Assessment Tax Assessment Total Assessment is a certain percentage of the fair market value that is determined by local assessors to be the total taxable value of land and additions on the property. | Land | Improvement |
|---|---|---|---|---|
| 2025 | $3,366 | $623,000 | $65,000 | $558,000 |
| 2024 | $3,366 | $635,000 | $62,600 | $572,400 |
| 2023 | $2,934 | $552,900 | $60,200 | $492,700 |
| 2022 | $3,044 | $560,900 | $49,100 | $511,800 |
| 2021 | $2,649 | $415,500 | $41,900 | $373,600 |
| 2020 | $2,429 | $359,900 | $37,500 | $322,400 |
| 2019 | $898 | $129,800 | $35,400 | $94,400 |
Source: Public Records
Map
Nearby Homes
- 262 E Sandy Sage Way
- 10556 S Sandy Sage Way
- 375 E 10560 S
- 10564 S Weeping Willow Dr
- 409 E 10185 S
- 601 E Pali St
- 101 E Rembrandt Cir
- 10510 S State St
- 717 Sand Dollar Dr
- 151 E Emilee Kaye Cir
- 222 Clear Creek Dr
- 9928 S Cascade Dr
- 10522 Amaryllis St
- 10491 Amaryllis St
- 8475 S State St
- 9822 S Darin Dr
- 845 Larkspur Dr
- 65 E 11000 S
- 9835 S 610 E
- 11035 S Grapevine Cove Unit 204
- 10437 S Beetdigger Blvd
- 10437 S Beetdigger Blvd Unit 75
- 10439 S Beetdigger Blvd
- 10439 S Beetdigger Blvd Unit 74
- 10433 S Beetdigger Blvd
- 10433 S Beetdigger Blvd Unit 76
- 10441 S Beetdigger Blvd Unit 73
- 10445 S Beetdigger Blvd Unit 58
- 10445 S Beetdigger Blvd
- 10429 S Beetdigger Blvd
- 10425 S Beetdigger Blvd Unit 78
- 10449 S Beetdigger Blvd Unit 57
- 10449 S Beetdigger Blvd
- 10421 S Beetdigger Blvd Unit 79
- 10453 S Beetdigger Blvd Unit 56
- 10453 S Crimson Sage Ln Unit 72
- 10455 S Crimson Sage Ln Unit 71
- 10455 S Crimson Sage Ln
- 10457 S Beetdigger Blvd
- 10457 S Beetdigger Blvd Unit 55
Your Personal Tour Guide
Ask me questions while you tour the home.