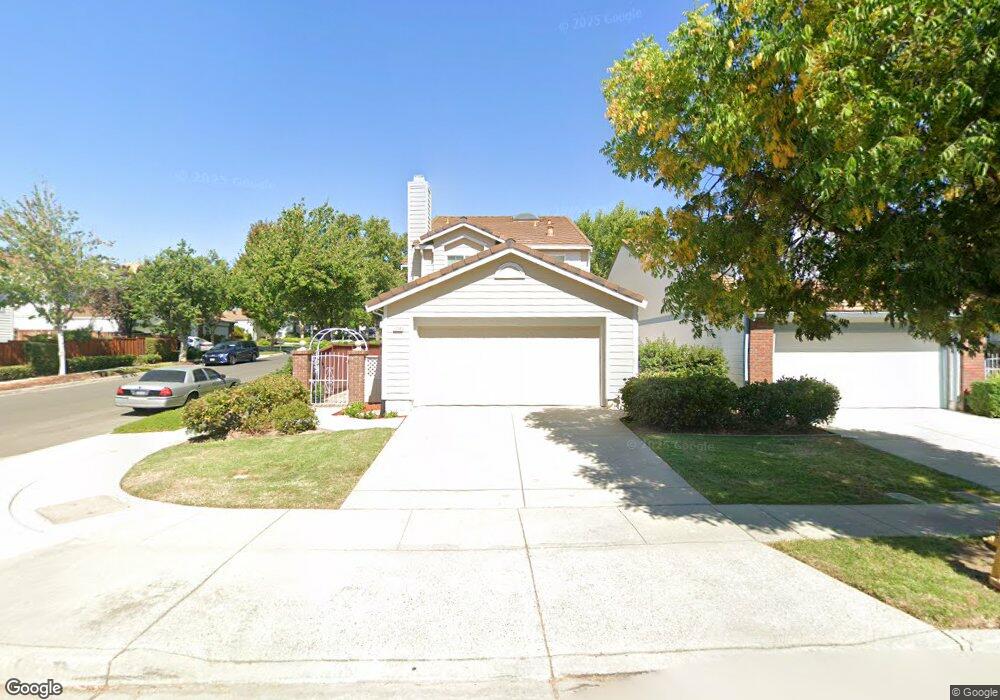
1044 Chipman Dr Milpitas, CA 95035
Estimated Value: $1,838,452 - $2,175,000
4
Beds
3
Baths
1,987
Sq Ft
$1,016/Sq Ft
Est. Value
About This Home
This home is located at 1044 Chipman Dr, Milpitas, CA 95035 and is currently estimated at $2,018,613, approximately $1,015 per square foot. 1044 Chipman Dr is a home located in Santa Clara County with nearby schools including John Sinnott Elementary School, Rancho Milpitas Middle School, and Milpitas High School.
Ownership History
Date
Name
Owned For
Owner Type
Purchase Details
Closed on
Jun 2, 2019
Sold by
York Christopher R and York Truc L
Bought by
York Christopher Robert and York Truc Linh
Current Estimated Value
Purchase Details
Closed on
Nov 1, 2010
Sold by
Perrina Toni
Bought by
York Christopher R and York Truc L
Home Financials for this Owner
Home Financials are based on the most recent Mortgage that was taken out on this home.
Original Mortgage
$417,000
Outstanding Balance
$275,971
Interest Rate
4.33%
Mortgage Type
New Conventional
Estimated Equity
$1,742,642
Purchase Details
Closed on
Nov 20, 1995
Sold by
Dec Timothy J
Bought by
Perrina Toni
Home Financials for this Owner
Home Financials are based on the most recent Mortgage that was taken out on this home.
Original Mortgage
$190,000
Interest Rate
4.05%
Create a Home Valuation Report for This Property
The Home Valuation Report is an in-depth analysis detailing your home's value as well as a comparison with similar homes in the area
Home Values in the Area
Average Home Value in this Area
Purchase History
| Date | Buyer | Sale Price | Title Company |
|---|---|---|---|
| York Christopher Robert | -- | None Available | |
| York Christopher R | $690,500 | Old Republic Title Company | |
| Perrina Toni | -- | First American Title Guarant |
Source: Public Records
Mortgage History
| Date | Status | Borrower | Loan Amount |
|---|---|---|---|
| Open | York Christopher R | $417,000 | |
| Previous Owner | Perrina Toni | $190,000 |
Source: Public Records
Tax History
| Year | Tax Paid | Tax Assessment Tax Assessment Total Assessment is a certain percentage of the fair market value that is determined by local assessors to be the total taxable value of land and additions on the property. | Land | Improvement |
|---|---|---|---|---|
| 2025 | $10,101 | $884,641 | $486,457 | $398,184 |
| 2024 | $10,101 | $867,296 | $476,919 | $390,377 |
| 2023 | $10,069 | $850,291 | $467,568 | $382,723 |
| 2022 | $10,026 | $833,619 | $458,400 | $375,219 |
| 2021 | $9,880 | $817,274 | $449,412 | $367,862 |
| 2020 | $9,707 | $808,895 | $444,804 | $364,091 |
| 2019 | $9,596 | $793,035 | $436,083 | $356,952 |
| 2018 | $9,111 | $777,486 | $427,533 | $349,953 |
| 2017 | $8,992 | $762,242 | $419,150 | $343,092 |
| 2016 | $8,628 | $747,297 | $410,932 | $336,365 |
| 2015 | $8,540 | $736,073 | $404,760 | $331,313 |
| 2014 | $8,312 | $721,656 | $396,832 | $324,824 |
Source: Public Records
Map
Nearby Homes
- 2235 Skyline Dr
- 913 Galindo Ct
- 2698 Greenrock Rd
- 1621 Tahoe Dr
- 1550 Clear Lake Ave
- 3312 Birchwood Ln
- 1601 Big Bend Dr
- 1479 Big Basin Dr
- 2074 Ashwood Ln
- 2085 Ashwood Ln
- 3139 Laneview Dr
- 1394 Glacier Dr
- 1371 Lassen Ave
- 1260 Glacier Dr
- 3184 Fernside Square
- 1787 Canton Dr
- 320 Monmouth Dr
- 1039 Big Bear Ct
- 529 Bryce Ct
- 3023 Postwood Dr
- 1050 Chipman Dr
- 1056 Chipman Dr
- 2232 Lynwood Terrace
- 1036 Chipman Dr
- 1062 Chipman Dr
- 2238 Lynwood Terrace
- 1030 Chipman Dr
- 1068 Chipman Dr
- 2244 Lynwood Terrace
- 2229 Lynwood Terrace
- 2249 Farmcrest St
- 1024 Chipman Dr
- 2235 Lynwood Terrace
- 1074 Chipman Dr
- 2250 Lynwood Terrace
- 2255 Farmcrest St
- 2241 Lynwood Terrace
- 1018 Chipman Dr
- 2261 Farmcrest St
- 2247 Lynwood Terrace
Your Personal Tour Guide
Ask me questions while you tour the home.