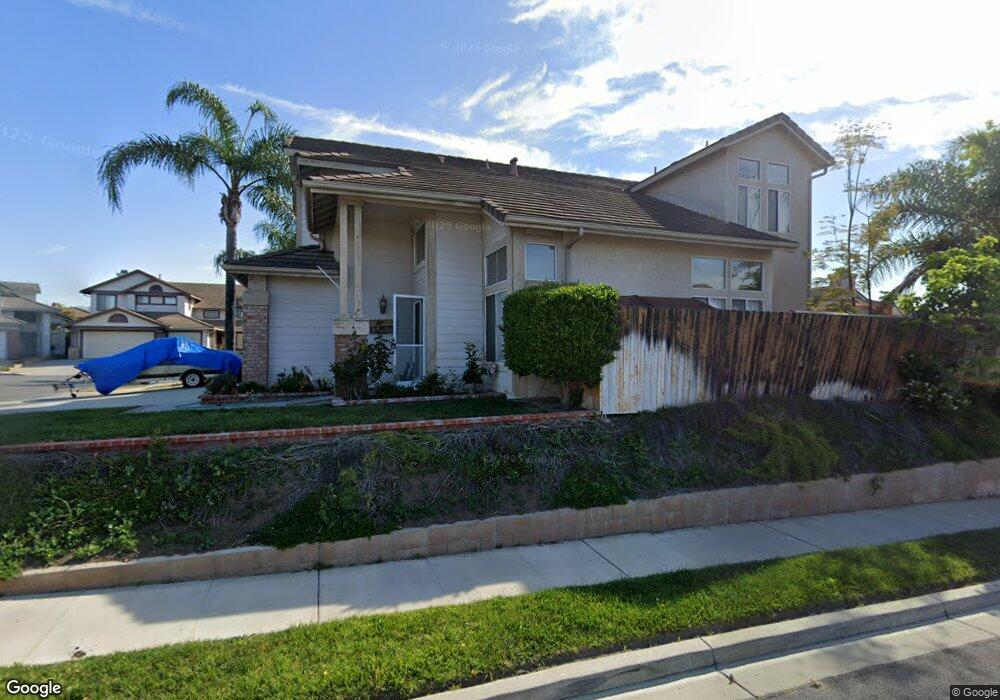
10444 Graham Ct Ventura, CA 93004
Estimated Value: $936,000 - $1,099,000
4
Beds
3
Baths
2,155
Sq Ft
$458/Sq Ft
Est. Value
About This Home
This home is located at 10444 Graham Ct, Ventura, CA 93004 and is currently estimated at $987,178, approximately $458 per square foot. 10444 Graham Ct is a home located in Ventura County with nearby schools including ATLAS School, Balboa Middle School, and Buena High School.
Ownership History
Date
Name
Owned For
Owner Type
Purchase Details
Closed on
Oct 28, 2008
Sold by
Feith Larry R and Feith Kimberleigh
Bought by
Finnegan Patrick J
Current Estimated Value
Home Financials for this Owner
Home Financials are based on the most recent Mortgage that was taken out on this home.
Original Mortgage
$355,000
Outstanding Balance
$230,948
Interest Rate
5.9%
Mortgage Type
Purchase Money Mortgage
Estimated Equity
$756,230
Purchase Details
Closed on
Apr 11, 1998
Sold by
Feith Larry R and Feith Kimberleigh M
Bought by
Feith Larry R and Kimberleigh Feith M
Home Financials for this Owner
Home Financials are based on the most recent Mortgage that was taken out on this home.
Original Mortgage
$196,000
Interest Rate
7.18%
Purchase Details
Closed on
Mar 7, 1996
Sold by
Wittenberg Livingston Inc
Bought by
Gallion M Kimberleigh and Feith Larry R
Home Financials for this Owner
Home Financials are based on the most recent Mortgage that was taken out on this home.
Original Mortgage
$197,500
Interest Rate
7.84%
Create a Home Valuation Report for This Property
The Home Valuation Report is an in-depth analysis detailing your home's value as well as a comparison with similar homes in the area
Home Values in the Area
Average Home Value in this Area
Purchase History
| Date | Buyer | Sale Price | Title Company |
|---|---|---|---|
| Finnegan Patrick J | $510,000 | Chicago Title Company | |
| Feith Larry R | -- | Lawyers Title Company | |
| Gallion M Kimberleigh | $219,500 | Chicago Title Co |
Source: Public Records
Mortgage History
| Date | Status | Borrower | Loan Amount |
|---|---|---|---|
| Open | Finnegan Patrick J | $355,000 | |
| Previous Owner | Feith Larry R | $196,000 | |
| Previous Owner | Gallion M Kimberleigh | $197,500 |
Source: Public Records
Tax History Compared to Growth
Tax History
| Year | Tax Paid | Tax Assessment Tax Assessment Total Assessment is a certain percentage of the fair market value that is determined by local assessors to be the total taxable value of land and additions on the property. | Land | Improvement |
|---|---|---|---|---|
| 2025 | $7,074 | $656,743 | $426,885 | $229,858 |
| 2024 | $7,074 | $643,866 | $418,515 | $225,351 |
| 2023 | $6,995 | $631,242 | $410,309 | $220,933 |
| 2022 | $6,500 | $618,865 | $402,264 | $216,601 |
| 2021 | $6,389 | $606,731 | $394,377 | $212,354 |
| 2020 | $6,331 | $600,512 | $390,334 | $210,178 |
| 2019 | $6,215 | $588,738 | $382,681 | $206,057 |
| 2018 | $6,111 | $577,195 | $375,178 | $202,017 |
| 2017 | $5,927 | $565,878 | $367,822 | $198,056 |
| 2016 | $5,822 | $554,783 | $360,610 | $194,173 |
| 2015 | $5,727 | $546,452 | $355,195 | $191,257 |
| 2014 | $5,645 | $535,749 | $348,238 | $187,511 |
Source: Public Records
Map
Nearby Homes
- 10488 Mammoth St
- 1531 Daphne Ave
- 1534 Pyramid Ave
- 1546 Daffodil Ave
- 10101 Telephone Rd
- 10265 Darling Rd
- 10134 Carlyle St
- 9813 Sweetwater Ln
- 10901 Darling Rd
- 644 S Saticoy Ave
- 10560 Henderson Rd
- 10041 Norwalk St
- 9570 Chamberlain St
- 918 Ann Arbor Ave
- 11218 Snapdragon St
- 10047 Blackburn Rd
- 9503 Chamberlain St
- 10685 Blackburn Rd Unit 72
- 1675 Arroyo Seco Dr
- 650 Charleston Place
- 10458 Graham Ct
- 10443 Saint Clair St
- 10457 Saint Clair St
- 10472 Graham Ct
- 1317 Phelps Ave
- 1303 Phelps Ave
- 10471 St Clair St
- 10471 Saint Clair St
- 1329 Phelps Ave
- 1291 Phelps Ave
- 10488 Graham Ct
- 10441 Graham Ct
- 1341 Phelps Ave
- 1277 Phelps Ave
- 10487 Saint Clair St
- 10489 Graham Ct
- 10463 Graham Ct
- 1357 Phelps Ave
- 1265 Phelps Ave
- 10471 Graham Ct