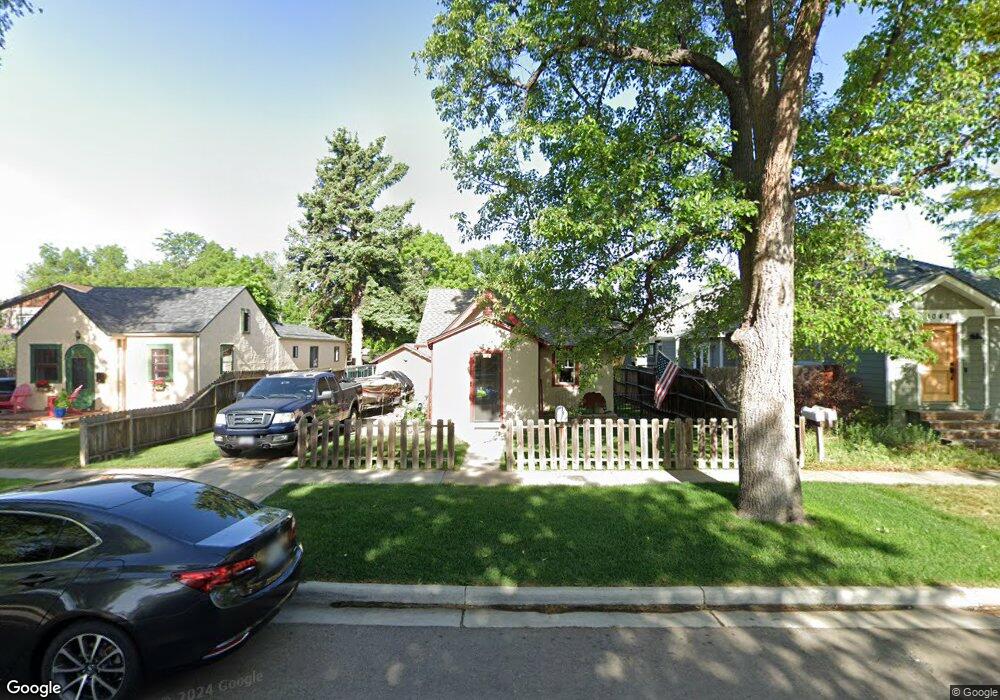
1045 Bross St Longmont, CO 80501
Loomiller NeighborhoodEstimated Value: $416,472 - $479,000
3
Beds
2
Baths
880
Sq Ft
$505/Sq Ft
Est. Value
About This Home
This home is located at 1045 Bross St, Longmont, CO 80501 and is currently estimated at $444,618, approximately $505 per square foot. 1045 Bross St is a home located in Boulder County with nearby schools including Mountain View Elementary School, Longs Peak Middle School, and Longmont High School.
Ownership History
Date
Name
Owned For
Owner Type
Purchase Details
Closed on
Jul 28, 2005
Sold by
Mead Lending Services Llc
Bought by
Kieffer Kevin
Current Estimated Value
Home Financials for this Owner
Home Financials are based on the most recent Mortgage that was taken out on this home.
Original Mortgage
$173,280
Outstanding Balance
$90,382
Interest Rate
5.55%
Mortgage Type
FHA
Estimated Equity
$354,236
Purchase Details
Closed on
Apr 20, 2004
Sold by
Beneficial Mortgage Co Of Colorado
Bought by
Mead Lending Services Llc
Purchase Details
Closed on
Mar 16, 2004
Sold by
Vernarsky Michael J and Vernarsky Brenda L
Bought by
Beneficial Mortgage Co Of Colorado
Purchase Details
Closed on
Apr 24, 1998
Sold by
Minnie Clark and Minnie Norman
Bought by
Vernarsky Michael J and Vernarsky Brenda L
Home Financials for this Owner
Home Financials are based on the most recent Mortgage that was taken out on this home.
Original Mortgage
$109,140
Interest Rate
7.21%
Mortgage Type
VA
Purchase Details
Closed on
Jul 1, 1974
Bought by
Kieffer Kevin
Create a Home Valuation Report for This Property
The Home Valuation Report is an in-depth analysis detailing your home's value as well as a comparison with similar homes in the area
Home Values in the Area
Average Home Value in this Area
Purchase History
| Date | Buyer | Sale Price | Title Company |
|---|---|---|---|
| Kieffer Kevin | $176,000 | Security Title | |
| Mead Lending Services Llc | $127,400 | Fahtco | |
| Beneficial Mortgage Co Of Colorado | -- | -- | |
| Vernarsky Michael J | $107,000 | -- | |
| Kieffer Kevin | -- | -- |
Source: Public Records
Mortgage History
| Date | Status | Borrower | Loan Amount |
|---|---|---|---|
| Open | Kieffer Kevin | $173,280 | |
| Previous Owner | Vernarsky Michael J | $109,140 |
Source: Public Records
Tax History Compared to Growth
Tax History
| Year | Tax Paid | Tax Assessment Tax Assessment Total Assessment is a certain percentage of the fair market value that is determined by local assessors to be the total taxable value of land and additions on the property. | Land | Improvement |
|---|---|---|---|---|
| 2025 | $2,274 | $28,213 | $5,400 | $22,813 |
| 2024 | $2,274 | $28,213 | $5,400 | $22,813 |
| 2023 | $2,243 | $23,772 | $6,010 | $21,447 |
| 2022 | $2,050 | $20,718 | $4,420 | $16,298 |
| 2021 | $2,077 | $21,314 | $4,547 | $16,767 |
| 2020 | $2,268 | $23,352 | $3,933 | $19,419 |
| 2019 | $2,233 | $23,352 | $3,933 | $19,419 |
| 2018 | $1,926 | $20,275 | $3,528 | $16,747 |
| 2017 | $1,900 | $22,415 | $3,900 | $18,515 |
| 2016 | $1,484 | $15,522 | $4,856 | $10,666 |
| 2015 | $1,414 | $13,619 | $4,298 | $9,321 |
| 2014 | $1,272 | $13,619 | $4,298 | $9,321 |
Source: Public Records
Map
Nearby Homes
- 1012 Pratt St Unit 1012
- 1019 Alta St Unit 1019
- 1136 Venice St
- 1209 Gay St
- 1214 9th Ave
- 814 Gay St
- 1217 Lincoln St
- 1314 Venice St
- 818 Lincoln St
- 1247 Lincoln St
- 900 Mountain View Ave Unit 213
- 1061 Townley Cir
- 1344 Aspen Place
- 1147 Emery St
- 1224 Judson St
- 623 Pratt St
- 820 Kimbark St Unit D
- 1202 Vivian St
- 836 Emery St
- 1153 Vivian St