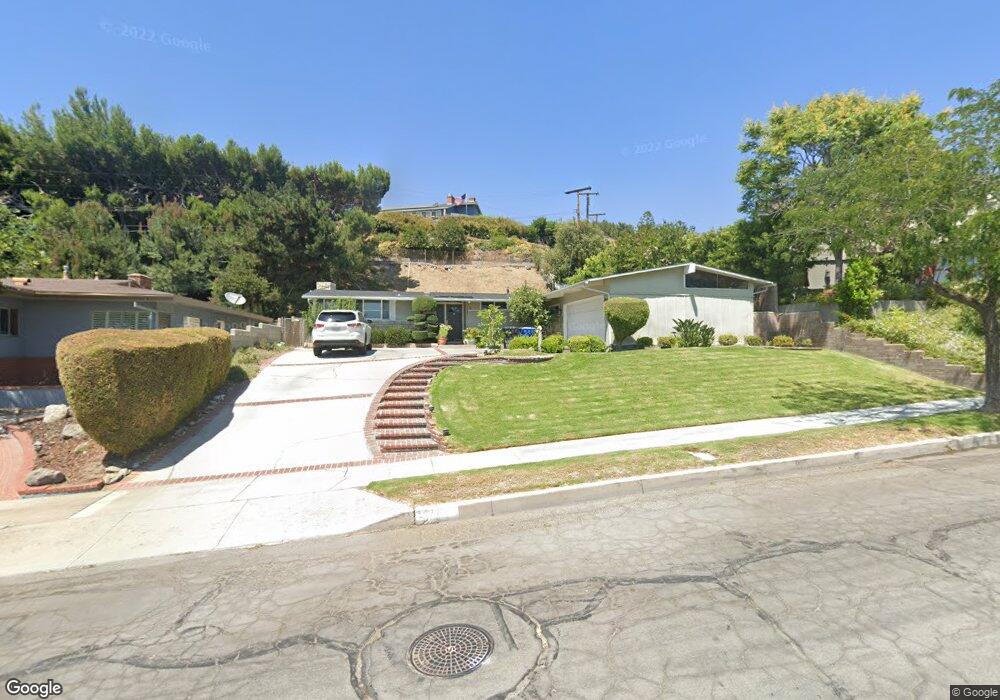
1045 Cornell Dr Burbank, CA 91504
Hillside District NeighborhoodEstimated Value: $1,398,000 - $1,733,000
4
Beds
3
Baths
1,970
Sq Ft
$809/Sq Ft
Est. Value
About This Home
This home is located at 1045 Cornell Dr, Burbank, CA 91504 and is currently estimated at $1,593,813, approximately $809 per square foot. 1045 Cornell Dr is a home located in Los Angeles County with nearby schools including Ralph Emerson Elementary School, John Muir Middle School, and Burbank High School.
Ownership History
Date
Name
Owned For
Owner Type
Purchase Details
Closed on
Jan 10, 2018
Sold by
Ngarayawongse Anuparb
Bought by
Ngarayawongse Justin and Ngarayawongse Connie
Current Estimated Value
Home Financials for this Owner
Home Financials are based on the most recent Mortgage that was taken out on this home.
Original Mortgage
$490,000
Outstanding Balance
$413,502
Interest Rate
3.94%
Mortgage Type
New Conventional
Estimated Equity
$1,180,311
Purchase Details
Closed on
Feb 28, 2006
Sold by
Ngarayawongse Anuparb
Bought by
Ngarayawongse Anuparb and Ngarayawongse Naiyana
Home Financials for this Owner
Home Financials are based on the most recent Mortgage that was taken out on this home.
Original Mortgage
$417,000
Interest Rate
6.04%
Mortgage Type
New Conventional
Purchase Details
Closed on
Jun 10, 1999
Sold by
Ngarayawongse Anuparb
Bought by
Ngarayawongse Anuparb and Ngarayawongse Naiyana
Create a Home Valuation Report for This Property
The Home Valuation Report is an in-depth analysis detailing your home's value as well as a comparison with similar homes in the area
Home Values in the Area
Average Home Value in this Area
Purchase History
| Date | Buyer | Sale Price | Title Company |
|---|---|---|---|
| Ngarayawongse Justin | $950,000 | First American Title Company | |
| Ngarayawongse Anuparb | -- | Accommodation | |
| Ngarayawongse Anuparb | -- | Investors Title Company | |
| Ngarayawongse Anuparb | -- | -- |
Source: Public Records
Mortgage History
| Date | Status | Borrower | Loan Amount |
|---|---|---|---|
| Open | Ngarayawongse Justin | $490,000 | |
| Previous Owner | Ngarayawongse Anuparb | $417,000 |
Source: Public Records
Tax History
| Year | Tax Paid | Tax Assessment Tax Assessment Total Assessment is a certain percentage of the fair market value that is determined by local assessors to be the total taxable value of land and additions on the property. | Land | Improvement |
|---|---|---|---|---|
| 2025 | $8,086 | $721,456 | $624,434 | $97,022 |
| 2024 | $8,086 | $707,311 | $612,191 | $95,120 |
| 2023 | $8,002 | $693,443 | $600,188 | $93,255 |
| 2022 | $7,643 | $679,847 | $588,420 | $91,427 |
| 2021 | $7,532 | $666,518 | $576,883 | $89,635 |
| 2019 | $7,253 | $969,000 | $775,200 | $193,800 |
| 2018 | $7,088 | $634,070 | $548,798 | $85,272 |
| 2016 | $6,722 | $609,450 | $527,489 | $81,961 |
| 2015 | $6,585 | $600,296 | $519,566 | $80,730 |
| 2014 | $6,569 | $588,538 | $509,389 | $79,149 |
Source: Public Records
Map
Nearby Homes
- 1012 N Sunset Canyon Dr
- 1083 E Fairmount Rd
- 902 E Walnut Ave
- 831 E Walnut Ave
- 637 E Fairmount Rd
- 1025 E San Jose Ave
- 815 E Magnolia Blvd
- 701 N 6th St
- 716 E San Jose Ave
- 527 E Cypress Ave Unit C
- 501 Birmingham Rd
- 615 E Magnolia Blvd
- 0 Country Club Dr Unit SB24168055
- 1113 N Glenoaks Blvd
- 505 Cambridge Dr
- 441 E San Jose Ave Unit 111
- 441 Dartmouth Rd
- 456 E San Jose Ave Unit B
- 330 N 5th St
- 660 Country Club Dr
- 1041 Cornell Dr
- 1049 Delaware Rd
- 1055 Delaware Rd
- 1147 N Sunset Canyon Dr
- 1037 Delaware Rd
- 1037 Cornell Dr
- 1061 Delaware Rd
- 1030 Cornell Dr
- 1031 Delaware Rd
- 1139 N Sunset Canyon Dr
- 1067 Delaware Rd
- 1033 Cornell Dr
- 1146 N Sunset Canyon Dr
- 1048 Delaware Rd
- 1054 Delaware Rd
- 1042 Delaware Rd
- 1024 Cornell Dr
- 1025 Delaware Rd
- 1140 N Sunset Canyon Dr
- 1131 N Sunset Canyon Dr
Your Personal Tour Guide
Ask me questions while you tour the home.