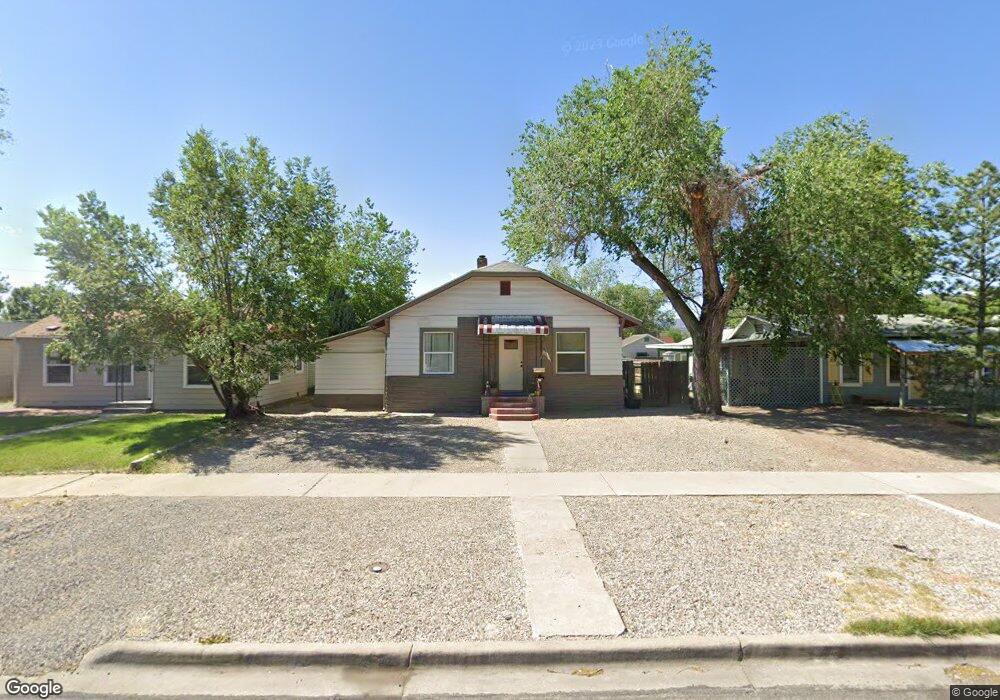
1045 Teller Ave Grand Junction, CO 81501
Downtown Grand Junction NeighborhoodEstimated Value: $313,000 - $406,000
3
Beds
2
Baths
1,608
Sq Ft
$225/Sq Ft
Est. Value
About This Home
This home is located at 1045 Teller Ave, Grand Junction, CO 81501 and is currently estimated at $361,866, approximately $225 per square foot. 1045 Teller Ave is a home located in Mesa County with nearby schools including Chipeta Elementary School, East Middle School, and West Middle School.
Ownership History
Date
Name
Owned For
Owner Type
Purchase Details
Closed on
Jun 25, 2015
Sold by
Porter Nathan E and Porter Brenda M
Bought by
On Track Investments Llc
Current Estimated Value
Purchase Details
Closed on
May 12, 2010
Sold by
Porter Homes Llc
Bought by
Porter Nathan E and Porter Brenda M
Purchase Details
Closed on
Nov 2, 2009
Sold by
Gj Housebuyers Llc
Bought by
Porter Homes Llc
Purchase Details
Closed on
Oct 30, 2009
Sold by
Fannie Mae
Bought by
Gj Housebuyers Llc
Purchase Details
Closed on
Sep 24, 2009
Sold by
Nationstar Mortgage Llc
Bought by
Federal National Mortgage Association
Purchase Details
Closed on
Aug 26, 1996
Sold by
Yeager Barbara J and Yeager Homer H
Bought by
Barnes Daniel G
Home Financials for this Owner
Home Financials are based on the most recent Mortgage that was taken out on this home.
Original Mortgage
$58,000
Interest Rate
8.42%
Purchase Details
Closed on
Jan 7, 1994
Sold by
Bruns Janise L
Bought by
On Track Investments Llc
Create a Home Valuation Report for This Property
The Home Valuation Report is an in-depth analysis detailing your home's value as well as a comparison with similar homes in the area
Home Values in the Area
Average Home Value in this Area
Purchase History
| Date | Buyer | Sale Price | Title Company |
|---|---|---|---|
| On Track Investments Llc | $120,000 | Land Title Guarantee Company | |
| Porter Nathan E | -- | None Available | |
| Porter Homes Llc | $103,000 | Land Title Guarantee Company | |
| Gj Housebuyers Llc | $87,000 | Ticor Title | |
| Federal National Mortgage Association | -- | None Available | |
| Barnes Daniel G | $60,000 | -- | |
| On Track Investments Llc | $40,000 | -- |
Source: Public Records
Mortgage History
| Date | Status | Borrower | Loan Amount |
|---|---|---|---|
| Previous Owner | Barnes Daniel G | $58,000 |
Source: Public Records
Tax History Compared to Growth
Tax History
| Year | Tax Paid | Tax Assessment Tax Assessment Total Assessment is a certain percentage of the fair market value that is determined by local assessors to be the total taxable value of land and additions on the property. | Land | Improvement |
|---|---|---|---|---|
| 2024 | $1,859 | $26,300 | $4,990 | $21,310 |
| 2023 | $1,859 | $26,300 | $4,990 | $21,310 |
| 2022 | $1,722 | $23,890 | $4,170 | $19,720 |
| 2021 | $1,728 | $24,580 | $4,290 | $20,290 |
| 2020 | $867 | $12,620 | $3,580 | $9,040 |
| 2019 | $820 | $12,620 | $3,580 | $9,040 |
| 2018 | $801 | $10,630 | $3,240 | $7,390 |
| 2017 | $697 | $10,630 | $3,240 | $7,390 |
| 2016 | $697 | $11,110 | $3,380 | $7,730 |
| 2015 | $706 | $11,110 | $3,380 | $7,730 |
| 2014 | $602 | $9,540 | $2,790 | $6,750 |
Source: Public Records
Map
Nearby Homes
- 1051 Teller Ave Unit 1-3
- 1051 Teller Ave Unit 2
- 1051 Teller Ave Unit 1
- 1061 Teller Ave
- 1023 Teller Ave
- 1030 Hill Ave
- 1021 Teller Ave
- 1044 Hill Ave
- 1020 Hill Ave
- 1050 Hill Ave
- 1030 Teller Ave
- 1060 Hill Ave
- 1005 Teller Ave
- 826 N 10th St
- 1016 Hill Ave
- 900 N 11th St
- 1002 Hill Ave
- 1029 Belford Ave
- 1045 Hill Ave
- 1055 Hill Ave