Estimated Value: $523,000 - $573,000
4
Beds
3
Baths
2,248
Sq Ft
$247/Sq Ft
Est. Value
About This Home
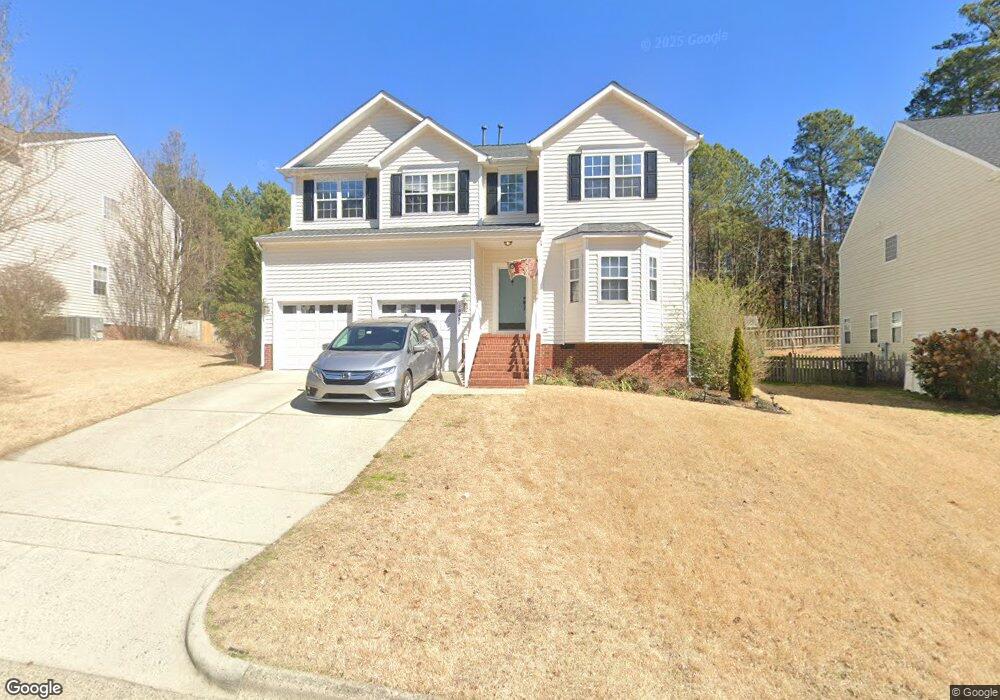
This home is located at 1045 Torrence Dr, Apex, NC 27502 and is currently estimated at $555,255, approximately $246 per square foot. 1045 Torrence Dr is a home located in Wake County with nearby schools including Baucom Elementary School, Apex Middle, and Apex High School.
Ownership History
Date
Name
Owned For
Owner Type
Purchase Details
Closed on
Dec 28, 2022
Sold by
Ortiz Orlando and Ortiz Anissa
Bought by
Ortiz Family Trust
Current Estimated Value
Purchase Details
Closed on
Sep 30, 2008
Sold by
Liu Shuangquan and Wang Yan
Bought by
Ortiz Orlando and Ortiz Anissa
Home Financials for this Owner
Home Financials are based on the most recent Mortgage that was taken out on this home.
Original Mortgage
$206,400
Interest Rate
6.49%
Mortgage Type
Purchase Money Mortgage
Purchase Details
Closed on
Aug 7, 2001
Sold by
Anderson Homes Inc
Bought by
Liu Shuangquan and Wang Yan
Home Financials for this Owner
Home Financials are based on the most recent Mortgage that was taken out on this home.
Original Mortgage
$155,600
Interest Rate
6.5%
Create a Home Valuation Report for This Property
The Home Valuation Report is an in-depth analysis detailing your home's value as well as a comparison with similar homes in the area
Purchase History
| Date | Buyer | Sale Price | Title Company |
|---|---|---|---|
| Ortiz Family Trust | -- | -- | |
| Ortiz Family Trust | -- | None Listed On Document | |
| Ortiz Orlando | $258,000 | None Available | |
| Liu Shuangquan | $195,000 | -- |
Source: Public Records
Mortgage History
| Date | Status | Borrower | Loan Amount |
|---|---|---|---|
| Previous Owner | Ortiz Orlando | $206,400 | |
| Previous Owner | Liu Shuangquan | $155,600 | |
| Closed | Liu Shuangquan | $29,175 |
Source: Public Records
Tax History
| Year | Tax Paid | Tax Assessment Tax Assessment Total Assessment is a certain percentage of the fair market value that is determined by local assessors to be the total taxable value of land and additions on the property. | Land | Improvement |
|---|---|---|---|---|
| 2025 | $4,496 | $512,617 | $200,000 | $312,617 |
| 2024 | $4,395 | $512,617 | $200,000 | $312,617 |
Source: Public Records
Map
Nearby Homes
- 101 Rocklyn Ln
- 0 Jb Morgan Rd Unit 10051948
- 105 Garden Side Way
- 1006 Cherokee Sunset Rd
- 111 Lemon Drop Cir
- 1224 Tartarian Trail
- 400 Village Loop Dr
- 1008 Daresbury Dr
- 1210 Evian Ct
- 440 Oak Pine Dr
- 203 Milky Way Dr
- 102 Licorice Dr
- 120 Licorice Dr
- 1303 Goldspot Ct
- 104 Fair Spring Ct
- 3021 White Cloud Cir
- 470 Magdala Place
- 1614 Brussels Dr
- 415 Fairview Rd
- 107 Maple Crest Ct
- 1039 Torrence Dr
- 1049 Torrence Dr
- 1033 Torrence Dr
- 1048 Torrence Dr
- 1040 Torrence Dr
- 1056 Torrence Dr
- 1029 Torrence Dr
- 110 Rocklyn Ln
- 1021 St Emilion Ct
- 1065 Torrence Dr
- 1021 Saint Emilion Ct
- 108 Rocklyn Ln
- 112 Rocklyn Ln
- 1030 Torrence Dr
- 106 Rocklyn Ln
- 1066 Torrence Dr
- 1020 St Emilion Ct
- 1020 Saint Emilion Ct
- 104 Rocklyn Ln
- 1090 Vauxhall Dr
Your Personal Tour Guide
Ask me questions while you tour the home.