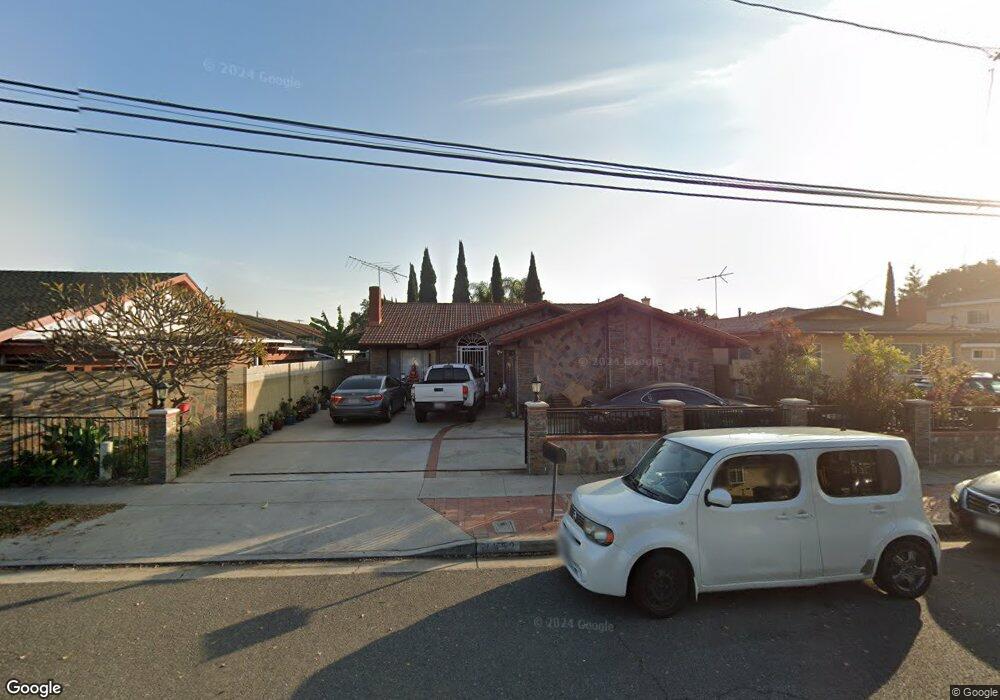
10452 Avenida Cinco de Mayo Fountain Valley, CA 92708
Estimated Value: $1,344,752 - $1,467,000
4
Beds
2
Baths
1,896
Sq Ft
$741/Sq Ft
Est. Value
About This Home
This home is located at 10452 Avenida Cinco de Mayo, Fountain Valley, CA 92708 and is currently estimated at $1,405,438, approximately $741 per square foot. 10452 Avenida Cinco de Mayo is a home located in Orange County with nearby schools including Cox (James H.) Elementary School, Masuda (Kazuo) Middle School, and Fountain Valley High School.
Ownership History
Date
Name
Owned For
Owner Type
Purchase Details
Closed on
Mar 22, 2023
Sold by
Steven Chiem and Steven Kathy Thuy
Bought by
Luu Nhien Thuy
Current Estimated Value
Purchase Details
Closed on
Nov 16, 2020
Sold by
Chiem Steven
Bought by
Steven Chiem & Kathy Thuy Do Revocable Living
Purchase Details
Closed on
Sep 11, 2003
Sold by
Chiem Steven and Chiem Hue
Bought by
Chiem Steven
Purchase Details
Closed on
Jun 29, 1995
Sold by
Chiem Steven
Bought by
Chiem Steven and Chiem Hue
Purchase Details
Closed on
Aug 20, 1993
Sold by
Cardona Arthur and Cardona Joan
Bought by
Chiem Steven
Home Financials for this Owner
Home Financials are based on the most recent Mortgage that was taken out on this home.
Original Mortgage
$162,000
Interest Rate
7.13%
Create a Home Valuation Report for This Property
The Home Valuation Report is an in-depth analysis detailing your home's value as well as a comparison with similar homes in the area
Home Values in the Area
Average Home Value in this Area
Purchase History
| Date | Buyer | Sale Price | Title Company |
|---|---|---|---|
| Luu Nhien Thuy | -- | None Listed On Document | |
| Steven Chiem & Kathy Thuy Do Revocable Living | -- | -- | |
| Chiem Steven | -- | -- | |
| Chiem Steven | -- | Southland Title Corp | |
| Chiem Steven | $203,000 | Commonwealth Land Title |
Source: Public Records
Mortgage History
| Date | Status | Borrower | Loan Amount |
|---|---|---|---|
| Previous Owner | Chiem Steven | $162,000 |
Source: Public Records
Tax History Compared to Growth
Tax History
| Year | Tax Paid | Tax Assessment Tax Assessment Total Assessment is a certain percentage of the fair market value that is determined by local assessors to be the total taxable value of land and additions on the property. | Land | Improvement |
|---|---|---|---|---|
| 2025 | $11,715 | $1,071,612 | $886,737 | $184,875 |
| 2024 | $11,715 | $1,050,600 | $869,350 | $181,250 |
| 2023 | $4,146 | $350,737 | $185,998 | $164,739 |
| 2022 | $4,084 | $343,860 | $182,351 | $161,509 |
| 2021 | $4,006 | $337,118 | $178,775 | $158,343 |
| 2020 | $3,982 | $333,662 | $176,942 | $156,720 |
| 2019 | $3,904 | $327,120 | $173,472 | $153,648 |
| 2018 | $3,831 | $320,706 | $170,070 | $150,636 |
| 2017 | $3,771 | $314,418 | $166,735 | $147,683 |
| 2016 | $3,613 | $308,253 | $163,465 | $144,788 |
| 2015 | $3,558 | $303,623 | $161,009 | $142,614 |
| 2014 | $3,489 | $297,676 | $157,855 | $139,821 |
Source: Public Records
Map
Nearby Homes
- 10452 Circulo de Juarez
- 10322 Avenida Cinco de Mayo
- 18021 Roch Ct
- 18016 Roch Ct
- 17071 Ward St
- 17210 San Mateo St Unit 25
- 17077 Los Modelos St
- 17288 San Lorenzo Cir
- 10430 La Cebra Ave
- 17333 Brookhurst St Unit D6
- 17333 Brookhurst St Unit B7
- 17401 Hood Ct
- 10900 La Flor Ave
- 17215 Buttonwood St
- 16767 Madrone Cir
- 10231 Bunting Ave
- 16806 Olive St
- 16379 Shadbush St
- 11356 Stonecress Ave
- 259 Albatross Ln
- 10442 Avenida Cinco de Mayo
- 17259 Ward St
- 17249 Ward St
- 17267 Ward St
- 10440 Avenida Cinco de Mayo
- 17275 Ward St
- 10451 Circulo de Juarez
- 10422 Avenida Cinco de Mayo
- 10441 Circulo de Juarez
- 17283 Ward St
- 10451 Avenida Cinco de Mayo
- 10441 Avenida Cinco de Mayo
- 10412 Avenida Cinco de Mayo
- 10421 Circulo de Juarez
- 17221 Ward St
- 17291 Ward St
- 10431 Avenida Cinco de Mayo
- 10411 Circulo de Juarez
- 10421 Avenida Cinco de Mayo
- 10402 Avenida Cinco de Mayo