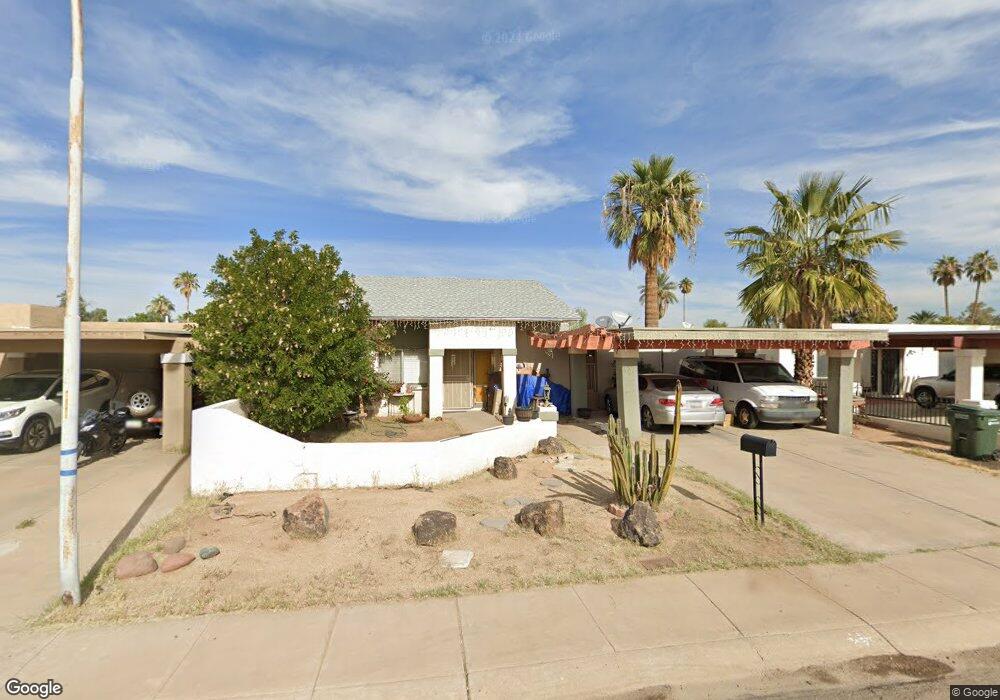
10454 W Monterosa St Phoenix, AZ 85037
Villa de Paz NeighborhoodEstimated Value: $214,143 - $295,000
2
Beds
1
Bath
924
Sq Ft
$284/Sq Ft
Est. Value
About This Home
This home is located at 10454 W Monterosa St, Phoenix, AZ 85037 and is currently estimated at $262,036, approximately $283 per square foot. 10454 W Monterosa St is a home located in Maricopa County with nearby schools including Villa De Paz Elementary School, Westview High School, and Legacy Traditional School - Phoenix.
Ownership History
Date
Name
Owned For
Owner Type
Purchase Details
Closed on
Nov 10, 2011
Sold by
Kope Commercialproperty Llc
Bought by
Mohs Edward
Current Estimated Value
Purchase Details
Closed on
May 26, 2009
Sold by
Mohs Edward
Bought by
Mireles Lisa
Home Financials for this Owner
Home Financials are based on the most recent Mortgage that was taken out on this home.
Original Mortgage
$70,000
Interest Rate
4.82%
Mortgage Type
Seller Take Back
Purchase Details
Closed on
May 7, 2009
Sold by
Mohs Edward
Bought by
Mohs Edward and Kope Commercialproperty Llc
Home Financials for this Owner
Home Financials are based on the most recent Mortgage that was taken out on this home.
Original Mortgage
$70,000
Interest Rate
4.82%
Mortgage Type
Seller Take Back
Purchase Details
Closed on
Feb 10, 2009
Sold by
Citibank Na
Bought by
Mohs Edward
Purchase Details
Closed on
May 14, 2008
Sold by
Rios Jose
Bought by
Citibank Na and Mlmi Trust Series 2006-He5
Purchase Details
Closed on
Jun 22, 2006
Sold by
Esquivel Maria G
Bought by
Rios Jose
Home Financials for this Owner
Home Financials are based on the most recent Mortgage that was taken out on this home.
Original Mortgage
$142,100
Interest Rate
7.2%
Mortgage Type
Balloon
Purchase Details
Closed on
Jun 1, 2006
Sold by
Johnson John D
Bought by
Rios Jose
Home Financials for this Owner
Home Financials are based on the most recent Mortgage that was taken out on this home.
Original Mortgage
$142,100
Interest Rate
7.2%
Mortgage Type
Balloon
Purchase Details
Closed on
Sep 14, 2005
Sold by
Johnson John D and Johnson Eirma
Bought by
Johnson John D
Home Financials for this Owner
Home Financials are based on the most recent Mortgage that was taken out on this home.
Original Mortgage
$56,000
Interest Rate
5.72%
Mortgage Type
New Conventional
Purchase Details
Closed on
Dec 31, 1997
Sold by
Hud
Bought by
Johnson John D
Home Financials for this Owner
Home Financials are based on the most recent Mortgage that was taken out on this home.
Original Mortgage
$40,000
Interest Rate
7.13%
Purchase Details
Closed on
Oct 10, 1997
Sold by
Foster Linda K
Bought by
Countrywide Home Loans Inc and Countrywide Funding Corp
Purchase Details
Closed on
Jul 22, 1997
Sold by
Countrywide Home Loans Inc
Bought by
Hud
Purchase Details
Closed on
Nov 4, 1994
Sold by
Riter Charles A and Riter Alice H
Bought by
Foster Linda K
Home Financials for this Owner
Home Financials are based on the most recent Mortgage that was taken out on this home.
Original Mortgage
$50,204
Interest Rate
8.91%
Mortgage Type
New Conventional
Create a Home Valuation Report for This Property
The Home Valuation Report is an in-depth analysis detailing your home's value as well as a comparison with similar homes in the area
Home Values in the Area
Average Home Value in this Area
Purchase History
| Date | Buyer | Sale Price | Title Company |
|---|---|---|---|
| Mohs Edward | -- | None Available | |
| Mireles Lisa | $70,000 | First American Title Ins Co | |
| Mohs Edward | -- | None Available | |
| Mohs Edward | $32,000 | Lsi Title Agency | |
| Citibank Na | $60,400 | None Available | |
| Rios Jose | -- | Transnation Title Ins Co | |
| Rios Jose | $177,625 | Transnation Title Ins Co | |
| Johnson John D | -- | First American Title Ins Co | |
| Johnson John D | -- | First Southwestern Title | |
| Countrywide Home Loans Inc | -- | Security Title Agency | |
| Hud | -- | Security Title Agency | |
| Foster Linda K | $49,900 | United Title Agency |
Source: Public Records
Mortgage History
| Date | Status | Borrower | Loan Amount |
|---|---|---|---|
| Previous Owner | Mireles Lisa | $70,000 | |
| Previous Owner | Rios Jose | $142,100 | |
| Previous Owner | Johnson John D | $56,000 | |
| Previous Owner | Johnson John D | $40,000 | |
| Previous Owner | Foster Linda K | $50,204 |
Source: Public Records
Tax History Compared to Growth
Tax History
| Year | Tax Paid | Tax Assessment Tax Assessment Total Assessment is a certain percentage of the fair market value that is determined by local assessors to be the total taxable value of land and additions on the property. | Land | Improvement |
|---|---|---|---|---|
| 2025 | $616 | $4,741 | -- | -- |
| 2024 | $627 | $4,515 | -- | -- |
| 2023 | $627 | $17,300 | $3,460 | $13,840 |
| 2022 | $602 | $12,600 | $2,520 | $10,080 |
| 2021 | $578 | $12,020 | $2,400 | $9,620 |
| 2020 | $561 | $10,680 | $2,130 | $8,550 |
| 2019 | $557 | $8,780 | $1,750 | $7,030 |
| 2018 | $523 | $7,570 | $1,510 | $6,060 |
| 2017 | $487 | $6,800 | $1,360 | $5,440 |
| 2016 | $446 | $5,860 | $1,170 | $4,690 |
| 2015 | $434 | $4,510 | $900 | $3,610 |
Source: Public Records
Map
Nearby Homes
- 10449 W Devonshire Ave
- 10461 W Devonshire Ave
- 10507 W Devonshire Ave
- 10526 W Devonshire Ave
- 4211 N 105th Ave
- 4215 N 105th Ave
- 4123 N 106th Ave
- 9524 W Flower St
- 9840 W Catalina Dr
- 9812 W Catalina Dr
- 9637 W Mulberry Dr
- 9536 W Flower St
- 2936 N 96th Ln
- 9533 W Cheery Lynn Rd
- 9634 W Flower St
- 9817 W Catalina Dr
- 9529 W Cheery Lynn Rd
- 2924 N 96th Ln
- 9529 W Pinchot Ave
- 9827 W Catalina Dr
- 10450 W Monterosa St
- 10453 W Devonshire Ave
- 10462 W Monterosa St Unit 1
- 10457 W Devonshire Ave
- 4140 N 104th Dr
- 4140 N 104th Dr Unit 71
- 4140 N 104th Dr Unit 67
- 4140 N 104th Dr Unit 65
- 4140 N 104th Dr Unit 72
- 4140 N 104th Dr Unit 29
- 4140 N 104th Dr Unit 64
- 4140 N 104th Dr Unit 70
- 4140 N 104th Dr Unit 69
- 4140 N 104th Dr Unit 27
- 4140 N 104th Dr Unit 28
- 4140 N 104th Dr Unit 74
- 4140 N 104th Dr Unit 68
- 4140 N 104th Dr Unit 63
- 4140 N 104th Dr Unit 75
- 4140 N 104th Dr Unit 66