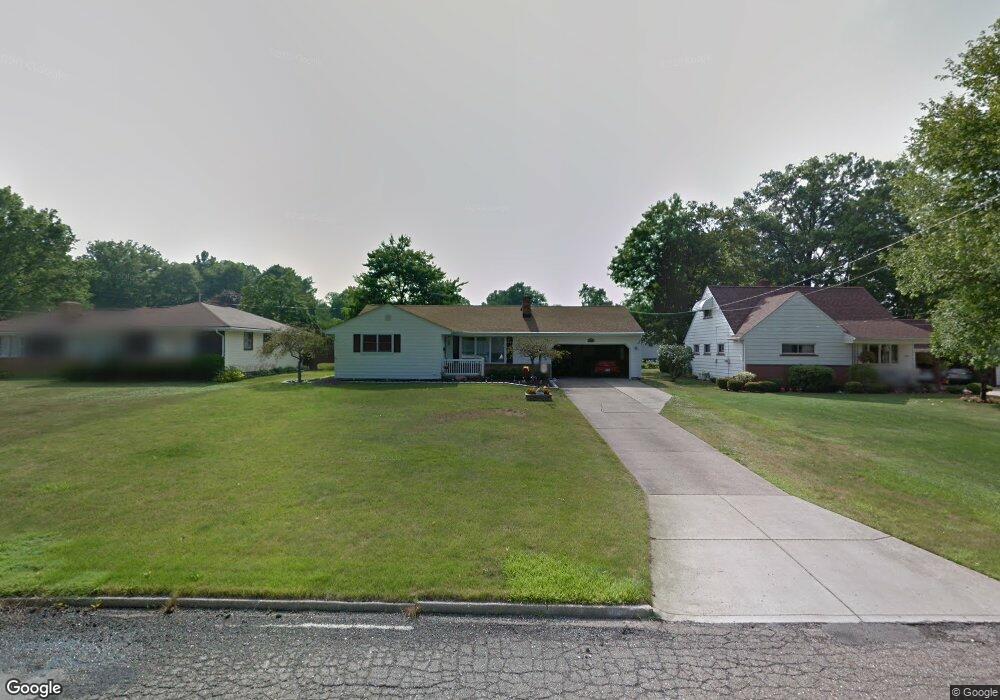
1046 Kirwan Dr Youngstown, OH 44515
Austintown NeighborhoodEstimated Value: $185,000 - $215,000
3
Beds
2
Baths
1,434
Sq Ft
$138/Sq Ft
Est. Value
About This Home
This home is located at 1046 Kirwan Dr, Youngstown, OH 44515 and is currently estimated at $197,361, approximately $137 per square foot. 1046 Kirwan Dr is a home located in Mahoning County with nearby schools including Austintown Elementary School, Austintown Intermediate School, and Austintown Middle School.
Ownership History
Date
Name
Owned For
Owner Type
Purchase Details
Closed on
Jun 10, 2021
Sold by
Ragan John and Miner Kalah
Bought by
Ragan John Anthony and Ragan Kalah Marie
Current Estimated Value
Home Financials for this Owner
Home Financials are based on the most recent Mortgage that was taken out on this home.
Original Mortgage
$140,000
Outstanding Balance
$126,753
Interest Rate
2.9%
Mortgage Type
New Conventional
Estimated Equity
$70,608
Purchase Details
Closed on
Dec 30, 2008
Sold by
Kaso Mary Anne
Bought by
Ragan John and Miner Kalah
Home Financials for this Owner
Home Financials are based on the most recent Mortgage that was taken out on this home.
Original Mortgage
$108,872
Interest Rate
6.06%
Mortgage Type
FHA
Purchase Details
Closed on
Feb 5, 2007
Sold by
Kaso James W and Kaso Mary Anne
Bought by
Kaso James W and Kaso Mary Anne
Purchase Details
Closed on
Sep 27, 1961
Bought by
Kaso James W and Kaso Mary Anne
Create a Home Valuation Report for This Property
The Home Valuation Report is an in-depth analysis detailing your home's value as well as a comparison with similar homes in the area
Home Values in the Area
Average Home Value in this Area
Purchase History
| Date | Buyer | Sale Price | Title Company |
|---|---|---|---|
| Ragan John Anthony | -- | Mortgage Connect Lp | |
| Ragan John | $112,000 | Attorney | |
| Kaso James W | -- | Attorney | |
| Kaso James W | -- | -- |
Source: Public Records
Mortgage History
| Date | Status | Borrower | Loan Amount |
|---|---|---|---|
| Open | Ragan John Anthony | $140,000 | |
| Closed | Ragan John | $108,872 |
Source: Public Records
Tax History Compared to Growth
Tax History
| Year | Tax Paid | Tax Assessment Tax Assessment Total Assessment is a certain percentage of the fair market value that is determined by local assessors to be the total taxable value of land and additions on the property. | Land | Improvement |
|---|---|---|---|---|
| 2024 | $2,359 | $51,050 | $7,580 | $43,470 |
| 2023 | $2,317 | $51,050 | $7,580 | $43,470 |
| 2022 | $2,073 | $36,630 | $7,130 | $29,500 |
| 2021 | $2,075 | $36,630 | $7,130 | $29,500 |
| 2020 | $2,083 | $36,630 | $7,130 | $29,500 |
| 2019 | $2,056 | $32,700 | $6,360 | $26,340 |
| 2018 | $2,187 | $32,700 | $6,360 | $26,340 |
| 2017 | $1,962 | $32,700 | $6,360 | $26,340 |
| 2016 | $2,068 | $34,140 | $6,670 | $27,470 |
| 2015 | $2,006 | $34,140 | $6,670 | $27,470 |
| 2014 | $2,015 | $34,140 | $6,670 | $27,470 |
| 2013 | $1,992 | $34,140 | $6,670 | $27,470 |
Source: Public Records
Map
Nearby Homes
- 3972 Artmar Dr
- 532 Westgate Blvd
- 3811 Artmar Dr
- 4102 Burkey Rd
- 653 S Meridian Rd
- 3890 Ayrshire Dr
- 1560 S Meridian Rd
- 565 S Meridian Rd
- 252 Rosemont Ave
- 263 S Main St
- 4234 Burkey Rd
- 3852 Edinburgh Dr
- 902 S Meridian Rd
- 4262 Pembrook Rd
- 3210 Quentin Dr
- 4235 Patricia Ave
- 136 Rosemont Ave
- 3828 Oakleigh Ave
- 208 S Roanoke Ave
- 0 Elmwood Ave
- 1038 Kirwan Dr
- 1054 Kirwan Dr
- 3943 Artmar Dr
- 3937 Artmar Dr
- 1030 Kirwan Dr
- 1043 Kirwan Dr
- 3931 Artmar Dr
- 1035 Kirwan Dr
- 1051 Kirwan Dr
- 1022 Kirwan Dr
- 3978 Artmar Dr
- 1027 Kirwan Dr
- 3984 Artmar Dr
- 3966 Artmar Dr
- 3942 Artmar Dr
- 3948 Artmar Dr
- 1019 Kirwan Dr
- 1064 Collins Ave
- 1014 Kirwan Dr
- 3988 Artmar Dr