1046 Vida Larga Loop Unit 10C Milpitas, CA 95035
Estimated Value: $1,153,000 - $1,448,000
3
Beds
3
Baths
1,646
Sq Ft
$758/Sq Ft
Est. Value
About This Home
This home is located at 1046 Vida Larga Loop Unit 10C, Milpitas, CA 95035 and is currently estimated at $1,247,782, approximately $758 per square foot. 1046 Vida Larga Loop Unit 10C is a home located in Santa Clara County with nearby schools including Pearl Zanker Elementary School, Rancho Milpitas Middle School, and Milpitas High School.
Ownership History
Date
Name
Owned For
Owner Type
Purchase Details
Closed on
Aug 25, 2020
Sold by
Tcu-Hsuan Chaen Susan and Chaen Susan
Bought by
Chaen Susan Tcu-Hsuan
Current Estimated Value
Home Financials for this Owner
Home Financials are based on the most recent Mortgage that was taken out on this home.
Original Mortgage
$257,000
Outstanding Balance
$181,781
Interest Rate
2.5%
Mortgage Type
New Conventional
Estimated Equity
$1,066,001
Purchase Details
Closed on
May 7, 2008
Sold by
Kb Home South Bay Inc
Bought by
Chaen Susan
Home Financials for this Owner
Home Financials are based on the most recent Mortgage that was taken out on this home.
Original Mortgage
$371,000
Interest Rate
5.87%
Mortgage Type
Purchase Money Mortgage
Create a Home Valuation Report for This Property
The Home Valuation Report is an in-depth analysis detailing your home's value as well as a comparison with similar homes in the area
Home Values in the Area
Average Home Value in this Area
Purchase History
| Date | Buyer | Sale Price | Title Company |
|---|---|---|---|
| Chaen Susan Tcu-Hsuan | -- | Chicago Title | |
| Chaen Susan | $571,000 | First American Title Company |
Source: Public Records
Mortgage History
| Date | Status | Borrower | Loan Amount |
|---|---|---|---|
| Open | Chaen Susan Tcu-Hsuan | $257,000 | |
| Previous Owner | Chaen Susan | $371,000 |
Source: Public Records
Tax History
| Year | Tax Paid | Tax Assessment Tax Assessment Total Assessment is a certain percentage of the fair market value that is determined by local assessors to be the total taxable value of land and additions on the property. | Land | Improvement |
|---|---|---|---|---|
| 2025 | $9,091 | $750,000 | $375,000 | $375,000 |
| 2024 | $9,091 | $735,296 | $367,648 | $367,648 |
| 2023 | $9,052 | $720,880 | $360,440 | $360,440 |
| 2022 | $8,992 | $706,746 | $353,373 | $353,373 |
| 2021 | $8,844 | $692,890 | $346,445 | $346,445 |
| 2020 | $8,689 | $685,786 | $342,893 | $342,893 |
| 2019 | $8,581 | $672,340 | $336,170 | $336,170 |
| 2018 | $8,156 | $659,158 | $329,579 | $329,579 |
| 2017 | $8,041 | $646,234 | $323,117 | $323,117 |
| 2016 | $7,717 | $633,564 | $316,782 | $316,782 |
| 2015 | $7,631 | $624,048 | $312,024 | $312,024 |
| 2014 | $7,425 | $611,824 | $305,912 | $305,912 |
Source: Public Records
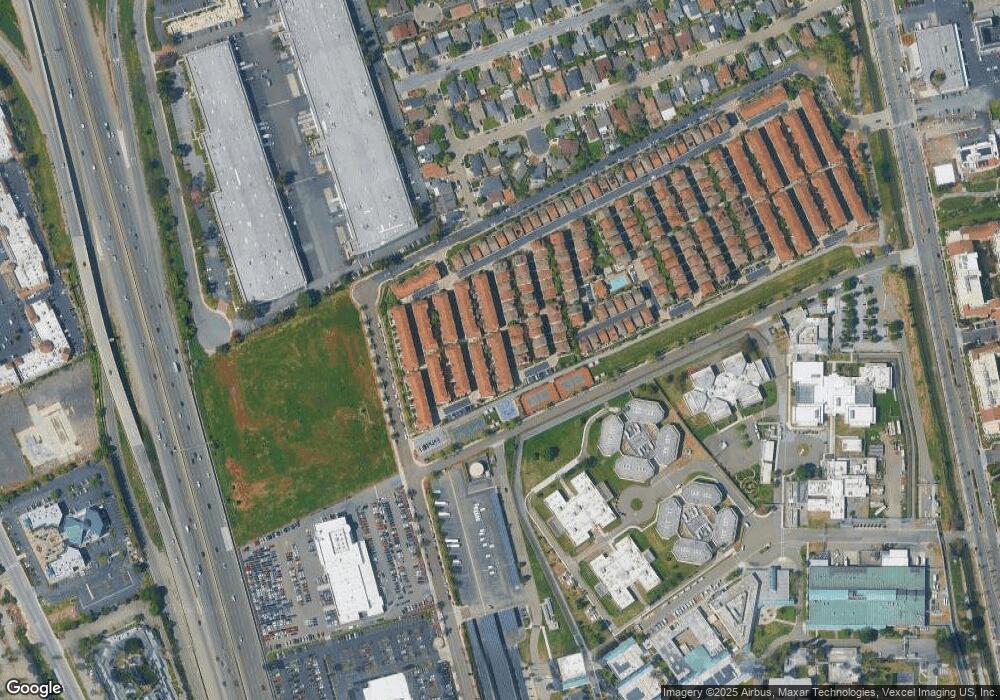
Map
Nearby Homes
- 917 Vida Larga Loop
- 770 Claridad Loop
- 690 Claridad Loop Unit 11E
- 760 Mente Linda Loop
- 600 S Abel St Unit 224
- 800 S Abel St Unit 218
- 800 S Abel St Unit 100
- 648 S Main St
- 660 S Main St
- 678 S Main St
- 646 S Main St
- 45 Parc Place Dr Unit RU2808
- 50 Serra Way
- 845 Fire Walk Unit 368
- 59 Wind Song
- 39 Cloud Walk Unit 328
- 52 Wind Song
- 839 Harmony Place Unit 126
- 1101 S Main St Unit 216
- 0 Railroad Ave
- 1032 Vida Larga Loop
- 1074 Vida Larga Loop Unit 10A
- 962 Vida Larga Loop Unit 10I
- 1060 Vida Larga Loop Unit 10B
- 1018 Vida Larga Loop Unit 10E
- 932 Luz Del Sol Loop Unit 91
- 806 Luz Del Sol Loop Unit 9B
- 788 Luz Del Sol Loop Unit 9A
- 1004 Vida Larga Loop
- 824 Luz Del Sol Loop Unit 9C
- 1088 Vida Larga Loop
- 1102 Vida Larga Loop Unit 11H
- 1007 Vida Larga Loop
- 844 Luz Del Sol Loop Unit 9D
- 975 Vida Larga Loop
- 1039 Vida Larga Loop
- 860 Luz Del Sol Loop
- 990 Vida Larga Loop
- 770 Luz Del Sol Loop
- 752 Luz Del Sol Loop
Your Personal Tour Guide
Ask me questions while you tour the home.