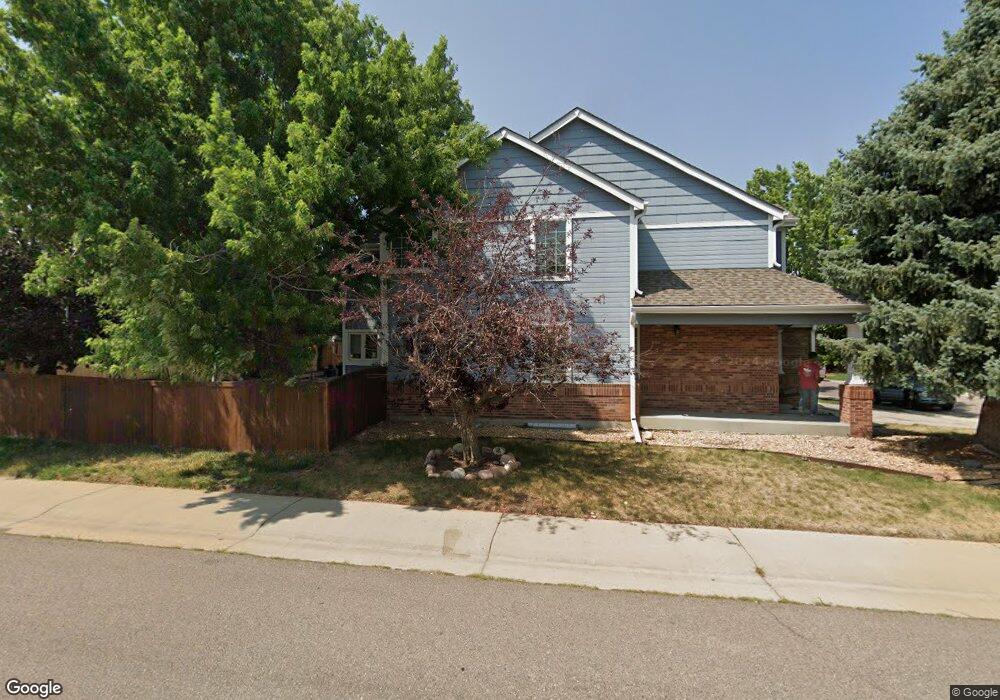
10467 Flowerhill Ct Parker, CO 80134
Stonegate NeighborhoodEstimated Value: $722,000 - $759,000
5
Beds
4
Baths
3,248
Sq Ft
$227/Sq Ft
Est. Value
About This Home
This home is located at 10467 Flowerhill Ct, Parker, CO 80134 and is currently estimated at $737,757, approximately $227 per square foot. 10467 Flowerhill Ct is a home located in Douglas County with nearby schools including Pine Grove Elementary School, Sierra Middle School, and Chaparral High School.
Ownership History
Date
Name
Owned For
Owner Type
Purchase Details
Closed on
Mar 8, 2019
Sold by
Houweling David L Van and Houweling Brenda J Van
Bought by
Hpa Us1 Llc
Current Estimated Value
Purchase Details
Closed on
Jul 10, 2013
Sold by
Houweling Brenda J
Bought by
Vanhouweling David L and Vanhouweling Van Houweling
Purchase Details
Closed on
May 21, 2012
Sold by
Vanhouweling David L and Vanhouweling Van Houweling
Bought by
Van Houweling Family Trust
Purchase Details
Closed on
Jan 20, 1994
Sold by
Elmore Michael L and Elmore Susan M
Bought by
Vanhouweling David L and Vanhouweling Brenda J
Home Financials for this Owner
Home Financials are based on the most recent Mortgage that was taken out on this home.
Original Mortgage
$120,000
Interest Rate
7.09%
Purchase Details
Closed on
Nov 9, 1992
Sold by
Falcon Partnership Ltd
Bought by
Elmore Michael L and Elmore Susan M
Purchase Details
Closed on
Apr 3, 1992
Sold by
Stonegate Dev Inc
Bought by
Falcon Homes Ltd
Create a Home Valuation Report for This Property
The Home Valuation Report is an in-depth analysis detailing your home's value as well as a comparison with similar homes in the area
Home Values in the Area
Average Home Value in this Area
Purchase History
| Date | Buyer | Sale Price | Title Company |
|---|---|---|---|
| Hpa Us1 Llc | $500,000 | Stewart Title | |
| Vanhouweling David L | -- | None Available | |
| Van Houweling Family Trust | -- | None Available | |
| Vanhouweling David L | $195,500 | Land Title | |
| Elmore Michael L | $177,900 | -- | |
| Falcon Homes Ltd | $267,500 | -- |
Source: Public Records
Mortgage History
| Date | Status | Borrower | Loan Amount |
|---|---|---|---|
| Previous Owner | Vanhouweling David L | $120,000 |
Source: Public Records
Tax History Compared to Growth
Tax History
| Year | Tax Paid | Tax Assessment Tax Assessment Total Assessment is a certain percentage of the fair market value that is determined by local assessors to be the total taxable value of land and additions on the property. | Land | Improvement |
|---|---|---|---|---|
| 2024 | $5,057 | $50,900 | $9,230 | $41,670 |
| 2023 | $5,100 | $50,900 | $9,230 | $41,670 |
| 2022 | $4,036 | $36,560 | $6,250 | $30,310 |
| 2021 | $4,150 | $36,560 | $6,250 | $30,310 |
| 2020 | $3,953 | $35,700 | $6,920 | $28,780 |
| 2019 | $3,857 | $35,700 | $6,920 | $28,780 |
| 2018 | $3,202 | $29,240 | $6,240 | $23,000 |
| 2017 | $3,020 | $29,240 | $6,240 | $23,000 |
| 2016 | $2,927 | $27,890 | $5,570 | $22,320 |
| 2015 | $1,491 | $27,890 | $5,570 | $22,320 |
| 2014 | $1,366 | $23,030 | $5,410 | $17,620 |
Source: Public Records
Map
Nearby Homes
- 10530 Winterflower Way
- 15565 Flowerhill Cir
- 10312 Stoneflower Dr
- 10519 Winterflower Way
- 10553 Stonemeadow Dr
- 10676 Cottoneaster Way
- 10539 Casper Point
- 10311 Mica Way
- 10397 Helsinki St
- 14938 Vienna Cir
- 14799 Munich Ave
- 10849 Tundra Top Dr
- 14969 Elsinore Ave
- 15033 Delhi Ave
- 10832 Tundra Top Dr
- 10158 Stoneridge Terrace
- 10873 Tundra Top Dr
- 14804 Rotterdam Ave
- 10828 Snowdon St
- 10834 Snowdon St
- 10459 Flowerhill Ct
- 10464 Stoneflower Dr
- 10456 Stoneflower Dr
- 10451 Flowerhill Ct
- 15438 Flowergate Way
- 15448 Flowergate Way
- 10440 Stoneflower Dr
- 10468 Flowerhill Ct
- 10460 Flowerhill Ct
- 15458 Flowergate Way
- 15428 Flowergate Way
- 10432 Stoneflower Dr
- 10443 Flowerhill Ct
- 10452 Flowerhill Ct
- 15468 Flowergate Way
- 15497 Flowergate Way
- 15397 Flowergate Way
- 10424 Stoneflower Dr
- 15478 Flowergate Way
- 10435 Flowerhill Ct