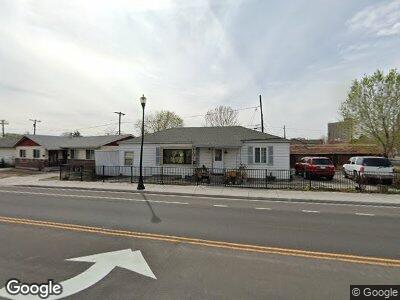
1047 Prater Way Sparks, NV 89431
Downtown Sparks NeighborhoodEstimated Value: $334,246 - $367,000
2
Beds
2
Baths
1,104
Sq Ft
$314/Sq Ft
Est. Value
About This Home
This home is located at 1047 Prater Way, Sparks, NV 89431 and is currently estimated at $346,312, approximately $313 per square foot. 1047 Prater Way is a home located in Washoe County with nearby schools including Robert Mitchell Elementary School, Sparks Middle School, and Sparks High School.
Ownership History
Date
Name
Owned For
Owner Type
Purchase Details
Closed on
Apr 11, 2007
Sold by
Velazquez Angeles Juan Jose and Velasquez Juan
Bought by
Velazquez Angeles Juan Jose and Velazquez Marie Angelica
Current Estimated Value
Home Financials for this Owner
Home Financials are based on the most recent Mortgage that was taken out on this home.
Original Mortgage
$87,000
Interest Rate
6.15%
Mortgage Type
Unknown
Purchase Details
Closed on
Mar 9, 1999
Sold by
Velasquez Maria Elena
Bought by
Velasquez Jacobo
Home Financials for this Owner
Home Financials are based on the most recent Mortgage that was taken out on this home.
Original Mortgage
$79,877
Interest Rate
6.7%
Mortgage Type
FHA
Purchase Details
Closed on
Feb 25, 1999
Sold by
Dearmond Sandena C
Bought by
Angels Juan Velasquez and Velasquez Jacobo
Home Financials for this Owner
Home Financials are based on the most recent Mortgage that was taken out on this home.
Original Mortgage
$79,877
Interest Rate
6.7%
Mortgage Type
FHA
Create a Home Valuation Report for This Property
The Home Valuation Report is an in-depth analysis detailing your home's value as well as a comparison with similar homes in the area
Home Values in the Area
Average Home Value in this Area
Purchase History
| Date | Buyer | Sale Price | Title Company |
|---|---|---|---|
| Velazquez Angeles Juan Jose | -- | First American Title | |
| Velasquez Jacobo | -- | First American Title Co | |
| Angels Juan Velasquez | $80,000 | First American Title Co |
Source: Public Records
Mortgage History
| Date | Status | Borrower | Loan Amount |
|---|---|---|---|
| Open | Velazquez Angeles Juan Jose | $85,028 | |
| Closed | Velazquez Angeles Juan Jose | $87,000 | |
| Closed | Velasquez Juan J | $15,000 | |
| Closed | Angels Juan Velasquez | $79,877 |
Source: Public Records
Tax History Compared to Growth
Tax History
| Year | Tax Paid | Tax Assessment Tax Assessment Total Assessment is a certain percentage of the fair market value that is determined by local assessors to be the total taxable value of land and additions on the property. | Land | Improvement |
|---|---|---|---|---|
| 2025 | $545 | $39,094 | $25,340 | $13,754 |
| 2024 | $545 | $35,853 | $22,288 | $13,565 |
| 2023 | $506 | $37,067 | $24,500 | $12,567 |
| 2022 | $889 | $28,405 | $18,144 | $10,261 |
| 2021 | $495 | $23,007 | $13,020 | $9,987 |
| 2020 | $464 | $22,456 | $12,656 | $9,800 |
| 2019 | $441 | $20,136 | $10,892 | $9,244 |
| 2018 | $421 | $17,025 | $8,176 | $8,849 |
| 2017 | $404 | $16,332 | $7,644 | $8,688 |
| 2016 | $394 | $14,644 | $5,936 | $8,708 |
| 2015 | $393 | $13,259 | $4,620 | $8,639 |
| 2014 | $380 | $11,162 | $3,052 | $8,110 |
| 2013 | -- | $10,101 | $2,184 | $7,917 |
Source: Public Records
Map
Nearby Homes